Generic selectors
Exact matches only
Search in title
Search in content
Post Type Selectors

Popular stocks

Crypto

CFD

Currencies

Support

Gold

NSDQ – Technical Analysis – 4h

January 21, 2026 08:01

Quick Summary

The NASDAQ 100 Index chart showcases a predominantly bearish trend. With significant downward momentum driven by technical indicators, market participants should closely monitor support and resistance levels for potential trading opportunities.

Traders should also consider external factors that may influence broader market trends and sentiment.

Candlestick Analysis

Recently, a series of red candlesticks indicates bearish pressure. No classic reversal patterns like a bullish engulfing or hammer are visible, which suggests continued bearish momentum.

The broader trend in this timeframe appears bearish, particularly with the series of lower highs and lower lows.

The recent drop below 25,000 points marks a potential zone of interest. This level previously acted as a minor support.

MACD Analysis

The MACD line is below the Signal line, indicating a bearish crossover which confirms the downward momentum.

The histogram shows increasing negative values, suggesting strengthening bearish momentum.

No significant divergences noted between MACD and price action.

Volume Analysis

A noticeable spike in volume occurred during recent declines, particularly highlighting a strong bearish sentiment.

Increased volume on down days supports the bearish price action, indicating stronger selling interest.

The spike may suggest institutional selling or panic selling by retail investors.

Support & Resistance

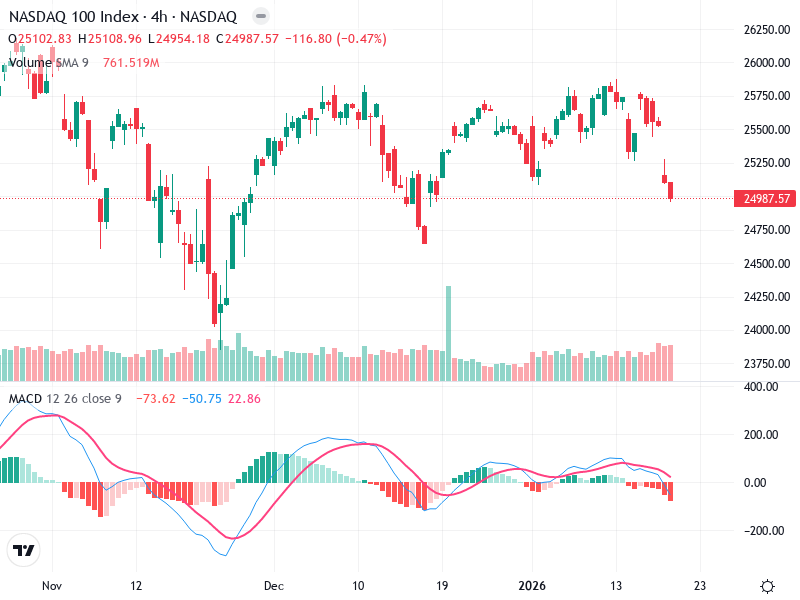
Support: Around 24,750, which could act as a psychological level.

Resistance: Near previous highs around 25,500 and 26,000, which would need to be broken to shift the trend.

Breaking through significant support could lead to further declines, while resistance holds could see consolidation.

Actionable Insights

If Bearish: Continue to hold or enter short positions, especially if the price continues to hold below 25,000 with volume support.

If Bullish: Await bullish reversal patterns or a break above resistance levels with confirming volume.

Watch for any changes in MACD or volume that suggest a shift in momentum.

The AI Technical Analysis Center is an informational tool only and does not constitute investment or trading advice.
This site is registered on wpml.org as a development site. Switch to a production site key to remove this banner.