Generic selectors
Exact matches only
Search in title
Search in content
Post Type Selectors

Popular stocks

Crypto

CFD

Currencies

Support

Gold

NZD/USD – Technical Analysis – 4h

January 22, 2026 13:01

Quick Summary

The New Zealand Dollar against the U.S. Dollar is showing a strong upward trend. Recent bullish patterns indicate a reversal from prior bearish movements. Key resistance levels are being tested, showcasing potential for further upward momentum.

Candlestick Analysis

The overall trend is bullish, with higher highs and higher lows following a previous downtrend.

A noticeable bullish engulfing pattern is forming, suggesting a reversal from the previous bearish trend.

A breakout above the 0.5860 level signifies continued upward momentum.

MACD Analysis

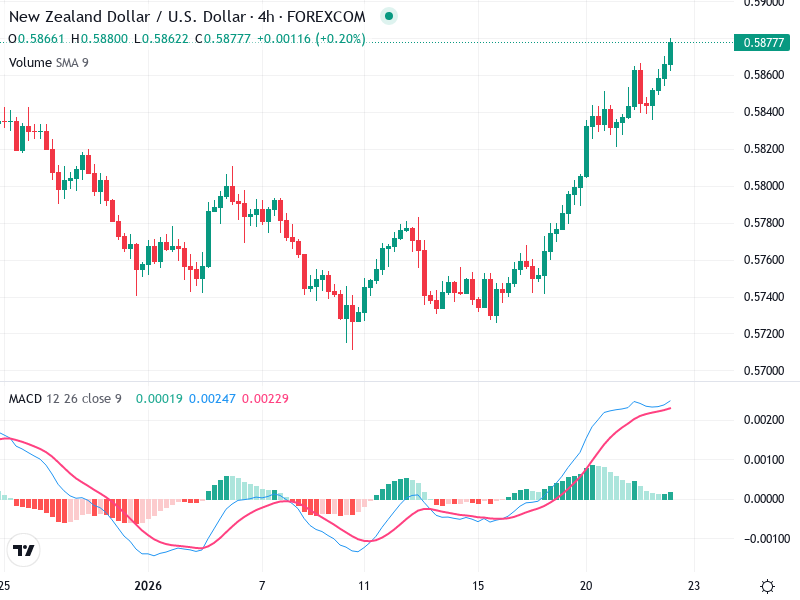
The MACD line has crossed above the Signal line, supporting the current upward trend.

Positive histogram bars indicate increasing bullish momentum, with rising bars suggesting strong buying pressure.

No significant divergence between MACD and price action, validating the upward move.

Volume Analysis

There was an increase in volume with the breakout above the resistance level, supporting the upward price movement.

The increase in volume suggests breakout validation and potential institutional activity.

The unusual volume spike indicates strong buying interest, reinforcing bullish sentiment.

Support & Resistance

Key support is near 0.5820, where the price consolidated before breaking out.

Key resistance might be encountered around the 0.5900 level based on historical price actions.

These levels are crucial for monitoring potential reversals or further breakouts.

Actionable Insights

Consider a long position during pullbacks to support near 0.5820 with a target near 0.5900. Use stops just below the support line to manage risk.

Watch for a potential bearish reversal or confirmed rejection near the resistance at 0.5900. Look for confirmation signals like bearish candlestick patterns.

A false breakout or declining volume on further price increases could indicate weakening buying pressure.

The AI Technical Analysis Center is an informational tool only and does not constitute investment or trading advice.
This site is registered on wpml.org as a development site. Switch to a production site key to remove this banner.