Generic selectors
Exact matches only
Search in title
Search in content
Post Type Selectors

Popular stocks

Crypto

CFD

Currencies

Support

Gold

GBP/USD – Technical Analysis – 4h

January 22, 2026 13:05

Quick Summary

The 4-hour chart for GBP/USD shows a consolidation pattern with significant interaction at key support and resistance levels. The asset is experiencing a sideways trend with minimal momentum indicating indecision in the market.

Candlestick Analysis

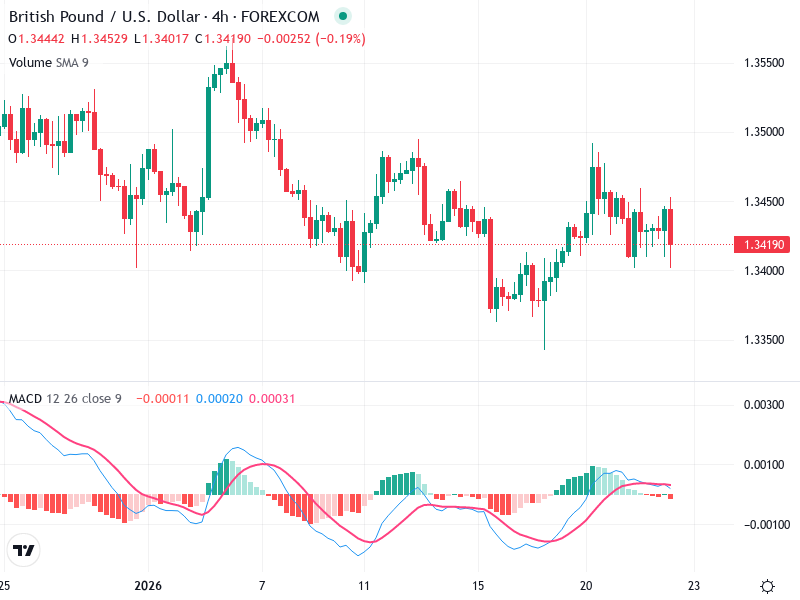
The presence of both bullish and bearish candles highlights a lack of strong trend, with doji and small-bodied candles indicating indecision.

An attempted bullish engulfing pattern on January 20 failed to drive a continuation, suggesting weak bullish momentum.

The price trend remains sideways, consolidating between 1.3400 and 1.3450, with potential breakout zones identified.

MACD Analysis

The MACD line remains aligned with the Signal line, signaling a lack of strong momentum in either direction.

The histogram indicates declining momentum, with smaller bars suggesting a potential continuation of the sideways trend.

Minimal divergence indicates that price and MACD are in sync with the current flat movement.

Volume Analysis

Volume remains stable, with no significant spikes indicating strong institutional activity.

The current volume levels do not strongly support any breakout attempts, indicating potential weak conviction behind moves.

No large changes in volume are supporting or contradicting existing price movements, reinforcing the neutral sentiment.

Support & Resistance

The support level at 1.3400 has been tested multiple times, confirming its significance.

The resistance level at 1.3450 is important, with multiple touchpoints emphasizing its role.

Sustained breaches of these levels could signal potential bullish or bearish reversals.

Actionable Insights

Advised to hold as the market consolidates; await clearer signals before making a move.

Watch for breakouts above 1.3450 to consider bullish strategies or breakdowns below 1.3400 for bearish strategies.

Look for high-volume movements or decisive crossovers in indicators for confirmation of market direction.

The AI Technical Analysis Center is an informational tool only and does not constitute investment or trading advice.
This site is registered on wpml.org as a development site. Switch to a production site key to remove this banner.