Generic selectors
Exact matches only
Search in title
Search in content
Post Type Selectors

Popular stocks

Crypto

CFD

Currencies

Support

Gold

OIL – Technical Analysis – 4h

January 22, 2026 17:00

Quick Summary

The asset is experiencing a bearish trend with lower highs and lows.

Key levels of support and resistance are influencing the current trading range.

Volume activity indicates substantial market interest during price drops.

Candlestick Analysis

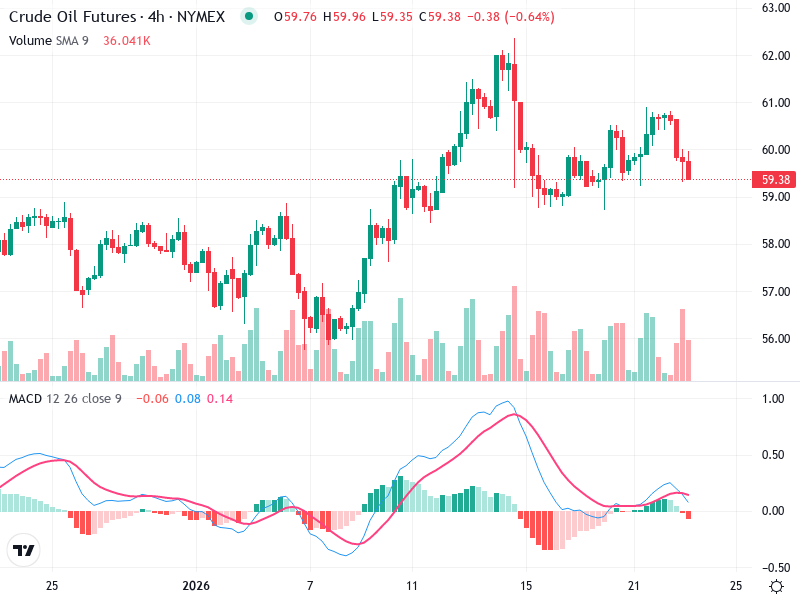
The chart shows a recent bearish trend with lower highs and lows, suggesting downward pressure in the market.

There are no clear single candlestick patterns like a hammer or bullish engulfing at the current price level. However, some smaller doji patterns might indicate indecisiveness.

A possible breakout zone is around the $60.00 level, previously tested as a resistance. Pullback areas seem to be around $58.50 where recent support was observed.

MACD Analysis

The MACD line is slightly below the Signal line, indicating a recent bearish crossover which could suggest downward momentum.

The histogram maintains a bearish stance with negative bars, indicating declining momentum.

No clear divergences are observed between the MACD and price action, which suggests the current movement is consistent with the recent trend.

Volume Analysis

A noticeable spike in volume occurs during the recent drop, supporting the bearish move. This increased activity might imply institutional selling.

The volume supports the price decline, indicating it's accompanied by strong selling interest.

There has been a moderate spike in volume during the price drop, suggesting potential increased interest or reaction from key market participants.

Support & Resistance

Key resistance is around the $61.00 level, tested multiple times without a sustained breakout.

Significant support is near the $58.50 mark, where the price has rebounded previously.

Monitoring these levels is crucial for identifying potential breakouts or reversals.

Actionable Insights

Sell: Traders might consider selling positions if the price breaks and holds below the $58.50 level with increased volume.

Hold: Holding is advised for long positions as long as the price remains above key support levels.

Buy: Consider potential buying positions if there is a confirmed breakout above $61.00 with strong volume.

The AI Technical Analysis Center is an informational tool only and does not constitute investment or trading advice.
This site is registered on wpml.org as a development site. Switch to a production site key to remove this banner.