Generic selectors
Exact matches only
Search in title
Search in content
Post Type Selectors

Popular stocks

Crypto

CFD

Currencies

Support

Gold

NZD/USD – Technical Analysis – 4h

January 26, 2026 13:01

Quick Summary

The chart presents a detailed view of the New Zealand Dollar/U.S. Dollar (NZD/USD) over a 4-hour timeframe.

The analysis highlights the current bullish trend with potential breakout or pullback scenarios.

Key focus is on candlestick patterns, MACD indicators, and support/resistance levels.

Candlestick Analysis

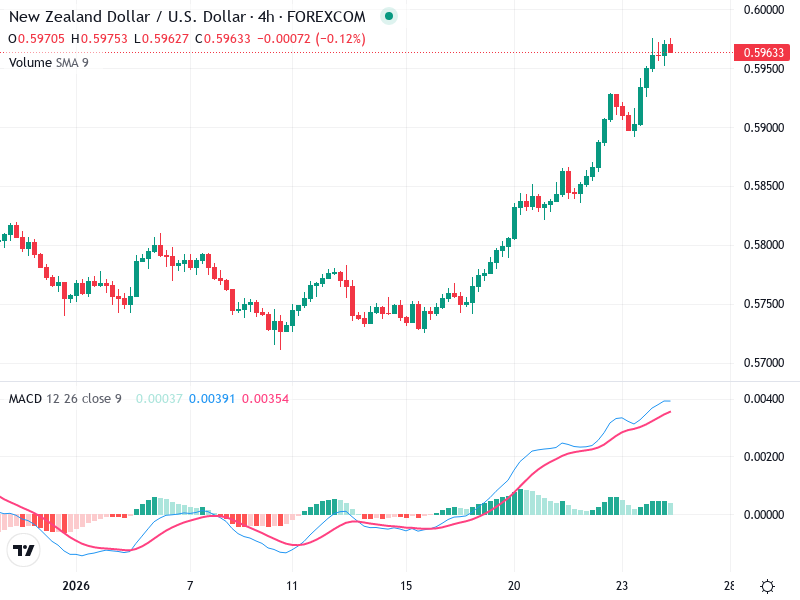
The chart shows a clear bullish trend with higher highs and higher lows.

Recent candles at the top show small bodies, possibly indicating indecision, which could suggest a potential slowing of momentum or a possible pullback.

The latest price action is near the recent highs, indicating a potential breakout if the price continues upwards. However, if a pullback occurs, previous resistance around 0.5900 might act as a support.

MACD Analysis

The MACD line is above the Signal line, which is a bullish signal. The lines are diverging, indicating strengthening momentum.

The histogram is positive and increasing, confirming upward momentum.

There are no significant divergences visible between the MACD and the price action, supporting the current trend strength.

Volume Analysis

The volume appears to be consistent with the upward trend. There aren’t any significant spikes or drops noted in the current section.

The volume is in line with the price increase, supporting the bullish trend.

No significant spikes to suggest heavy institutional buying or selling.

Support & Resistance

The key resistance level is at the recent high around 0.5975.

If there is a pullback, watch for support around the previous highs, notably near 0.5900.

Actionable Insights

Consider a buy strategy if the price breaks above the current resistance with strong volume. Be cautious of a potential pullback if the momentum shows signs of weakening at these levels.

A bearish candlestick pattern or a MACD crossover to the downside could indicate near-term reversal risks.

The overall sentiment appears bullish, but near-term caution is advised given the recent small-bodied candles suggesting indecision.

The AI Technical Analysis Center is an informational tool only and does not constitute investment or trading advice.
This site is registered on wpml.org as a development site. Switch to a production site key to remove this banner.