Generic selectors
Exact matches only
Search in title
Search in content
Post Type Selectors

Popular stocks

Crypto

CFD

Currencies

Support

Gold

GOLD – Technical Analysis – 4h

January 26, 2026 17:03

Quick Summary

The gold Futures 4h chart provides a detailed view of recent price movements. Observing the bullish trend, traders might find opportunities to capitalize on upward momentum. Pay attention to the critical levels for potential shifts.

Candlestick Analysis

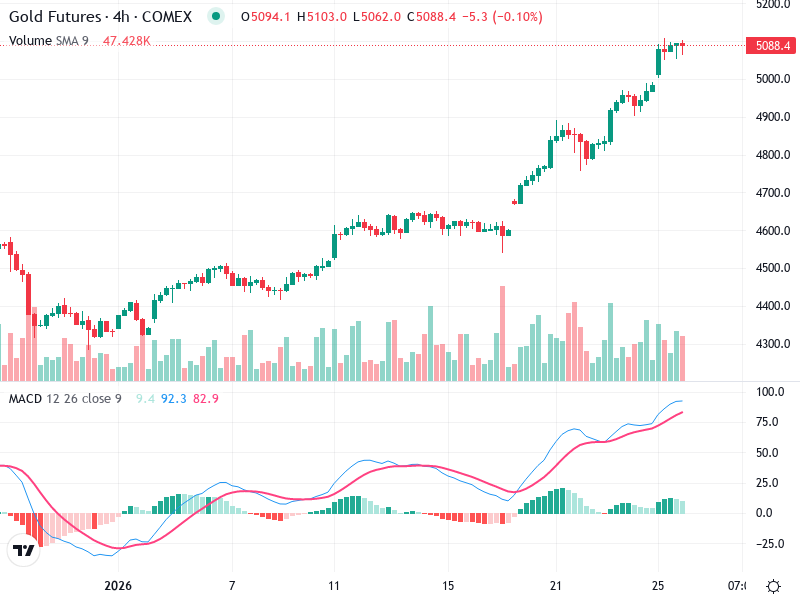
The overall trend is bullish, with the price consistently moving upwards, marked by higher highs and higher lows.

The chart shows recent tight consolidation at the top, indicating a possible pause or continuation of the upward trend.

The price is near a breakout zone around 5100, which could trigger more bullish momentum if crossed.

MACD Analysis

The MACD line is positioned above the Signal line, indicating a bullish crossover.

The MACD histogram is positive, with increasing bar lengths that suggest strengthening bullish momentum.

No major divergences between the MACD and price action are visible, reinforcing the current uptrend.

Volume Analysis

Volume has gradually increased alongside the price, supporting the bullish trend.

There are noticeable volume spikes during bullish candles, potentially indicating institutional buying activity.

Rising volume correlates with rising prices, emphasizing the strength of the trend.

Support & Resistance

Around 4900 appears to be a significant support level, forming a base for recent upward movements.

The 5100 level might act as a resistance, warranting careful observation for potential breakouts.

Monitoring these levels could provide insights into future price direction and momentum shifts.

Actionable Insights

Consider short-term buying entries on breakouts above 5100, provided volume backs the move.

Look for a confirmed breakout with solid volume or signs of exhaustion, such as a reversal pattern, at current levels.

A break below 4900 support could signal a potential trend reversal, demanding vigilant risk management.

The AI Technical Analysis Center is an informational tool only and does not constitute investment or trading advice.
This site is registered on wpml.org as a development site. Switch to a production site key to remove this banner.