Generic selectors
Exact matches only
Search in title
Search in content
Post Type Selectors

Popular stocks

Crypto

CFD

Currencies

Support

Gold

AUD/USD – Technical Analysis – 4h

January 27, 2026 13:02

Quick Summary

The AUD/USD chart indicates a strong bullish trend with increasing positive bars on the MACD histogram.

The current price movements suggest further potential gains if resistance levels are breached.

The upward momentum appears to be supported by positive market sentiment.

Candlestick Analysis

The chart shows a strong bullish trend with a series of higher highs and higher lows from around the 16th.

The recent candlesticks exhibit a continuation pattern, with no reversal patterns like doji or hammer evident.

The level around 0.6948 marks a potential breakout zone, maintaining the upward momentum.

MACD Analysis

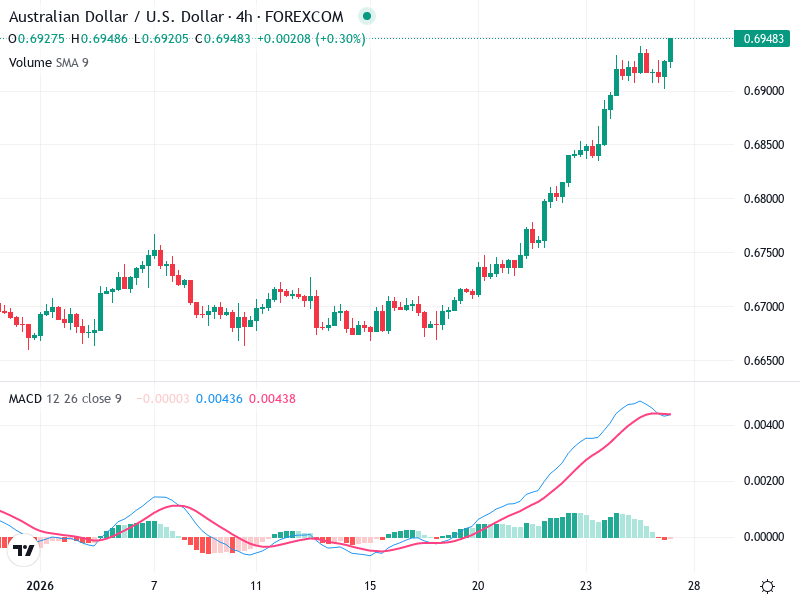
The MACD line is positioned above the Signal line, suggesting a bullish crossover supporting upward momentum.

The MACD histogram displays increasing positive bars, reinforcing the strong bullish momentum.

There are no bearish divergences, as price action aligns well with MACD readings.

Volume Analysis

The upward price movement lacks a visible volume spike, indicating steady buying activity rather than speculative surges.

Absent significant volume spikes, no notable institutional activity is evident.

Observing increased volume could provide more confirmation of trend strength.

Support & Resistance

A key support level is near 0.6800, acting as a previous consolidation zone.

The immediate resistance level is around the current price of 0.6948; breaking this could signal further gains.

Monitoring these levels is crucial for assessing potential breakout opportunities.

Actionable Insights

Consider buying upon breakout confirmation above 0.6948, with 0.6800 as a stop-loss to manage risk.

Current holders should maintain positions, as momentum favors continued gains.

Watch for breakout confirmation with increased volume or a significant candlestick pattern for enhanced reliability.

The AI Technical Analysis Center is an informational tool only and does not constitute investment or trading advice.
This site is registered on wpml.org as a development site. Switch to a production site key to remove this banner.