Generic selectors
Exact matches only
Search in title
Search in content
Post Type Selectors

Popular stocks

Crypto

CFD

Currencies

Support

Gold

OIL – Technical Analysis – 4h

January 27, 2026 17:01

Quick Summary

The chart reflects a currently bullish outlook for the asset, showcasing a recovery from previous downtrends. Key levels such as 61.50 are crucial in determining future price action.

The asset’s technical indicators, including MACD and volume trends, confirm the potential for sustained upward movement.

Candlestick Analysis

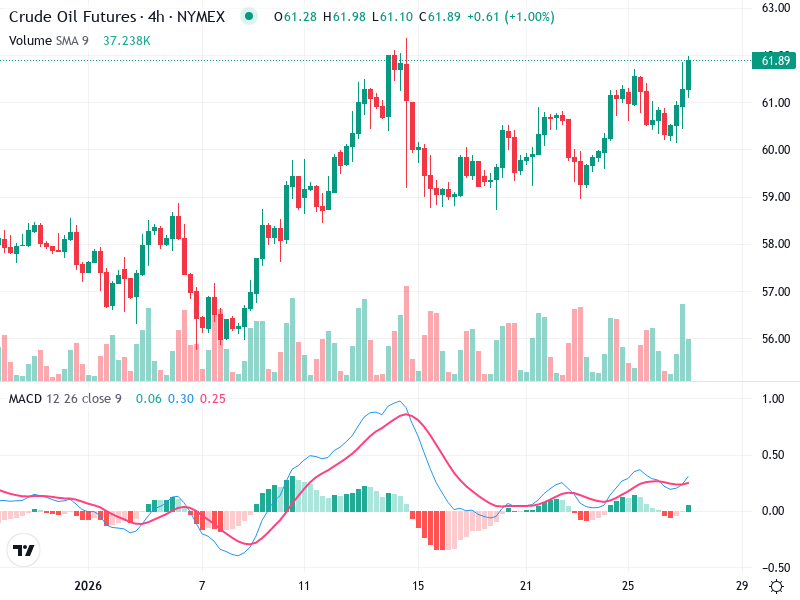
A potential bullish engulfing pattern emerges towards the right side of the chart, indicating a potential uptrend continuation.

Notable rejection from lower prices with some hammer-like patterns visible in recent sessions.

The trend appears bullish in the short-term, evidenced by higher highs and higher lows. There has been a recovery from a prior downtrend.

A breakout has occurred above the 61.50 level, which was a previous resistance. This could now act as support.

MACD Analysis

The MACD line is above the Signal line, suggesting a bullish crossover recently occurred.

The increasing gap between the lines indicates growing bullish momentum.

The histogram is in positive territory and expanding, reinforcing the bullish momentum.

No significant divergences are noted currently between the MACD and the price action.

Volume Analysis

There was a notable increase in volume accompanying the recent price rise, confirming the bullish move.

Increasing volume during uptrends typically confirms the trend, which is supportive of recent price action.

The spikes indicate possible institutional participation, particularly during upward price movements.

Support & Resistance

61.50 now acts as a support level after the breakout.

A significant resistance level is near 62.00, which, if breached, could suggest a further upward movement.

Actionable Insights

Consider entering or adding to a long position if the price sustains above 61.50 with continued volume support.

Consider shorting if the price falls back below the newly established support at 61.50 with declining volume.

Confirmation of the breakout by watching if the price holds above the 61.50 support.

Look for any MACD signal line crosses or histogram contractions as potential early reversal signals.

The AI Technical Analysis Center is an informational tool only and does not constitute investment or trading advice.
This site is registered on wpml.org as a development site. Switch to a production site key to remove this banner.