Generic selectors
Exact matches only
Search in title
Search in content
Post Type Selectors

Popular stocks

Crypto

CFD

Currencies

Support

Gold

NSDQ – Technical Analysis – 4h

January 29, 2026 08:01

Quick Summary

The asset chart shows a significant bullish trend after a decisive breakout above previous resistance levels. Indicators suggest strong but slightly slowing momentum.

Current movements hint at potential consolidation, with traders watching for key support and resistance levels in the near term.

Candlestick Analysis

There appears to be a bullish engulfing pattern formed after the December low, followed by a consistent uptrend.

Recently, there's evidence of small-bodied candles near the top, suggesting potential indecision.

The trend is bullish, indicated by the recent run-up in price, although the latest candles suggest a potential pause or consolidation.

MACD Analysis

The MACD line is above the Signal line, indicating a bullish crossover.

The histogram is positive, suggesting increasing upward momentum, but it seems to be flattening, indicating a potential slow-down.

There are no clear divergences at the moment, as MACD generally supports the price action.

Volume Analysis

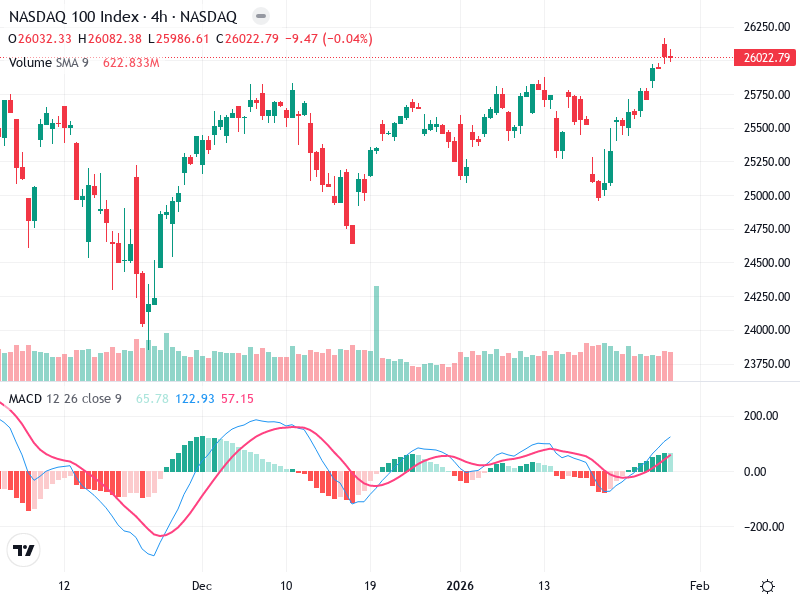
There's a notable spike in volume during the initial breakout, confirming the upward move.

Volume supported the breakout; however, recent volume appears to be average, matching the small-bodied candles, indicative of possible consolidation.

An isolated volume spike occurred mid-December, indicating possible institutional activity, which was followed by a price increase.

Support & Resistance

Key support level is expected around 25,750, corresponding with the recent breakout.

Potential resistance is near the 26,250 level, where recent price action has paused.

Watch for pullbacks to support levels as potential buying opportunities.

Actionable Insights

Consider a hold strategy at current levels. For new entries, watch for a pullback to 25,750 as a potential buy zone, provided volume supports the level holding.

Monitor any reversal patterns, especially if the MACD histogram continues flattening and volume remains low or decreases.

A move below 25,750 on high volume could signal bearish sentiment.

The AI Technical Analysis Center is an informational tool only and does not constitute investment or trading advice.
This site is registered on wpml.org as a development site. Switch to a production site key to remove this banner.