Generic selectors
Exact matches only
Search in title
Search in content
Post Type Selectors

Popular stocks

Crypto

CFD

Currencies

Support

Gold

EUR/USD – Technical Analysis – 4h

January 29, 2026 08:03

Quick Summary

The chart indicates a bullish trend overall with some caution required due to potential short-term pullbacks. The asset has recently experienced a breakout above key resistance levels. Traders should closely watch support and resistance levels for further market movements.

Candlestick Analysis

The current candlestick pattern shows a strong bullish trend with a series of higher highs and higher lows.

A potential bearish reversal pattern is developing as a bearish candlestick appears after a strong bullish run.

The price has recently broken above previous resistance levels at 1.1900, but a minor pullback is underway.

MACD Analysis

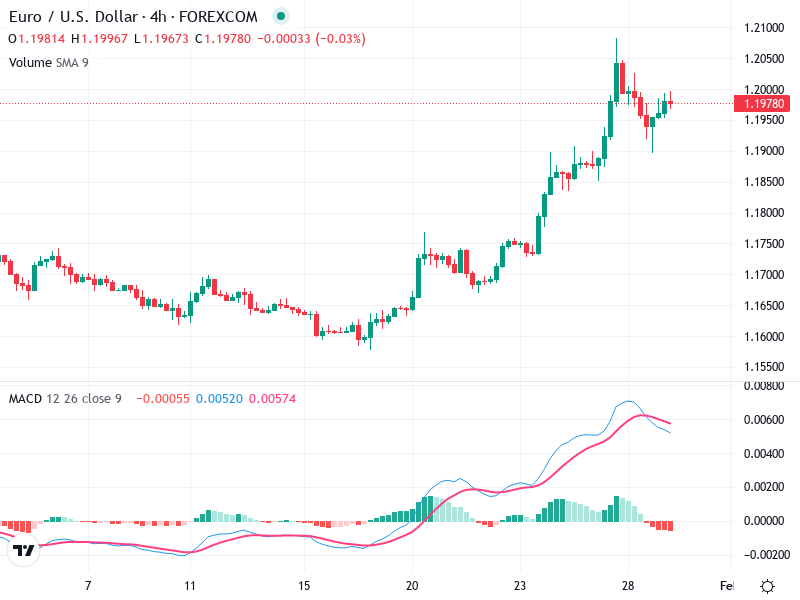
The MACD line is above the Signal line, suggesting bullish momentum, but convergence hints at a potential weakening of momentum.

The MACD histogram is showing decreasing bars, indicating a loss of bullish momentum and the possibility of a bearish crossover.

Currently, no significant divergences are observed in the MACD data.

Volume Analysis

There was a significant increase in volume during the recent bullish breakout, which aligns with the upward price movement.

Current volume levels are reduced compared to the breakout phase, suggesting a decline in trading activity.

The initial volume spike could indicate possible institutional activity during the breakout.

Support & Resistance

The key support level is identified at 1.1900, which was the breakout point and is critical for bulls.

Immediate resistance is observed around 1.2050, which is the recent peak to monitor closely.

Traders should watch these levels for potential testing and reactions.

Actionable Insights

Consider buying on confirmation of support at 1.1900 or after spotting a bullish reversal pattern above this level.

Consider selling if the price breaks decisively below the 1.1900 support, signaling a bearish trend.

Traders may hold positions and wait for a price break above 1.2050 to confirm a continued uptrend.

The AI Technical Analysis Center is an informational tool only and does not constitute investment or trading advice.
This site is registered on wpml.org as a development site. Switch to a production site key to remove this banner.