Generic selectors
Exact matches only
Search in title
Search in content
Post Type Selectors

Popular stocks

Crypto

CFD

Currencies

Support

Gold

NZD/USD – Technical Analysis – 4h

January 30, 2026 13:00

Quick Summary

The chart shows distinct technical patterns.

This analysis provides insights into potential future movements for the asset.

The main focus is on breakouts and momentum changes.

Candlestick Analysis

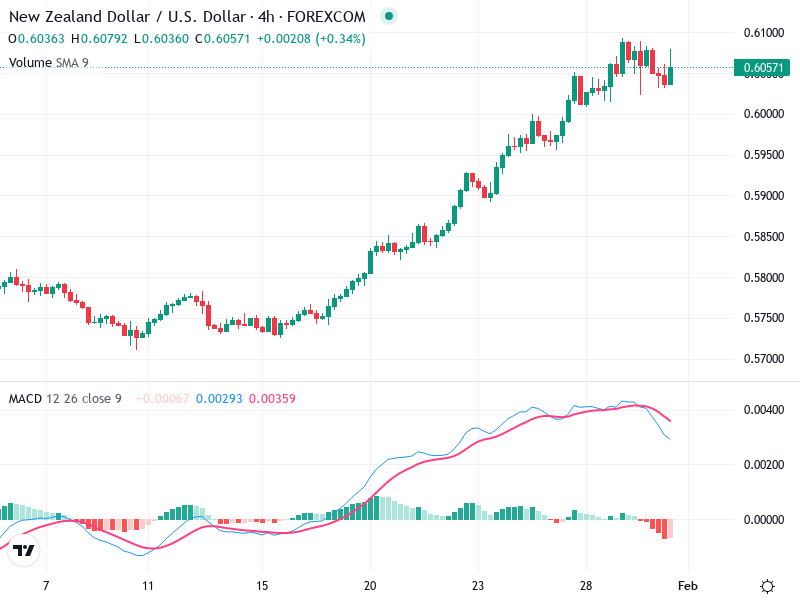
The overall trend is bullish, evidenced by a series of higher highs and higher lows.

There is a visible small consolidation zone around the 0.605 level, suggesting a potential breakout or pullback.

A move above recent highs of around 0.610 would confirm a continuation of the bullish trend.

MACD Analysis

The MACD line is above the Signal line but is starting to converge, indicating a potential weakening of bullish momentum.

The histogram is showing declining positive values, suggesting reduced bullish momentum.

No clear divergence is observed between MACD and price action.

Volume Analysis

Volume appears relatively stable.

No significant volume spikes indicate institutional activity at this time.

The stable volume suggests the current price movement is not strongly supported by increased trading activity, which could signify a lack of conviction in this upward movement.

Support & Resistance

Support Zone: Around 0.600, a psychological level and previous consolidation area.

Resistance Zone: Approximately 0.610, which is the recent high.

Keep an eye on these levels for potential trading opportunities.

Actionable Insights

Consider buying on a confirmed breakout above 0.610 with increased volume.

A close below the 0.600 support level may indicate a trend reversal.

Stay watchful for confirmation signals before making a decision.

The AI Technical Analysis Center is an informational tool only and does not constitute investment or trading advice.
This site is registered on wpml.org as a development site. Switch to a production site key to remove this banner.