Generic selectors
Exact matches only
Search in title
Search in content
Post Type Selectors

Popular stocks

Crypto

CFD

Currencies

Support

Gold

GBP/USD – Technical Analysis – 4h

January 30, 2026 13:04

Quick Summary

The GBP/USD 4-Hour Chart shows a predominant bullish trend with some consolidation.

Key support and resistance levels are identified at 1.3700 and 1.3800 respectively.

Candlestick Analysis

The overall trend observed in the chart is bullish, with a strong upward trajectory since mid-January.

A notable bullish run is apparent, followed by a consolidation phase, which may suggest a potential pullback or continuation pattern.

The recent highs around 1.3800 are significant as potential breakout or pullback zones. Watch for confirmation.

MACD Analysis

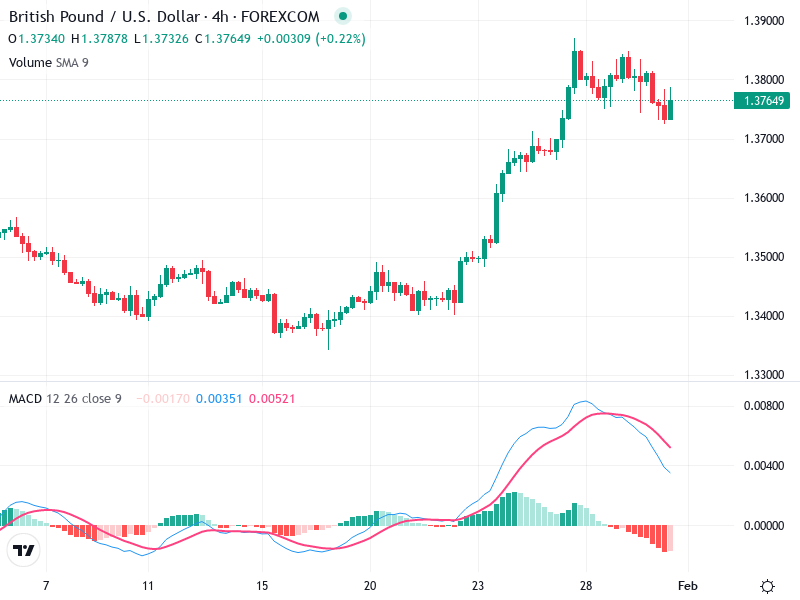
The MACD line has crossed below the Signal line, indicating a recent bearish crossover. This suggests a potential change in momentum.

The histogram shows a shift to the negative, reinforcing bearish momentum. However, the magnitude is not very large yet, indicating a need for caution.

There appears to be no significant divergence between MACD and price action at present.

Volume Analysis

The recent volume shows a slight decline, which often accompanies consolidation phases.

Current volume doesn’t strongly support the recent price movements, hinting at insufficient conviction.

No pronounced spikes to suggest strong institutional activity.

Support & Resistance

A key support level is observed around 1.3700, which is critical for maintaining the bullish sentiment.

The 1.3800 level serves as immediate resistance. A breakout above would be necessary for further bullish confirmation.

Traders should monitor these levels closely for potential trading opportunities.

Actionable Insights

Traders might consider a cautiously optimistic approach. A breakdown below 1.3700 could suggest a bearish turn, while a breakout above 1.3800 would confirm continued bullish momentum.

Look for confirmation signals such as a bullish candlestick pattern or increased volume before assuming a bullish continuation.

Maintaining a focus on volume changes and candlestick patterns is essential for timing entry and exit points effectively.

The AI Technical Analysis Center is an informational tool only and does not constitute investment or trading advice.
This site is registered on wpml.org as a development site. Switch to a production site key to remove this banner.