Generic selectors
Exact matches only
Search in title
Search in content
Post Type Selectors

Popular stocks

Crypto

CFD

Currencies

Support

Gold

NSDQ – Technical Analysis – 4h

February 2, 2026 08:00

Quick Summary

The NASDAQ 100 Index is currently experiencing significant chart activity.

The latest analysis shows potential trend changes worth monitoring.

This overview will provide critical insights for understanding the index’s movements.

Candlestick Analysis

There is a recent bearish engulfing pattern visible at the peak, indicating a potential reversal from the recent highs.

The trend appears to be sideways with recent bearish momentum after failing to sustain new highs.

The index tested a resistance around 26,000 and failed to break through, leading to a pullback.

MACD Analysis

There is a bearish crossover recently, where the MACD line has crossed below the Signal line, suggesting a potential downward momentum.

The histogram is moving into negative territory, reinforcing the bearish momentum and suggesting decreasing bullish strength.

There is no significant divergence observed currently between MACD and the price action.

Volume Analysis

A noticeable increase in volume occurred at the recent peak and subsequent drop, indicating strong selling pressure.

The spike in volume supports the recent bearish movement, suggesting institutional selling.

The volume spike could indicate strong participation in the selling at resistance levels.

Support & Resistance

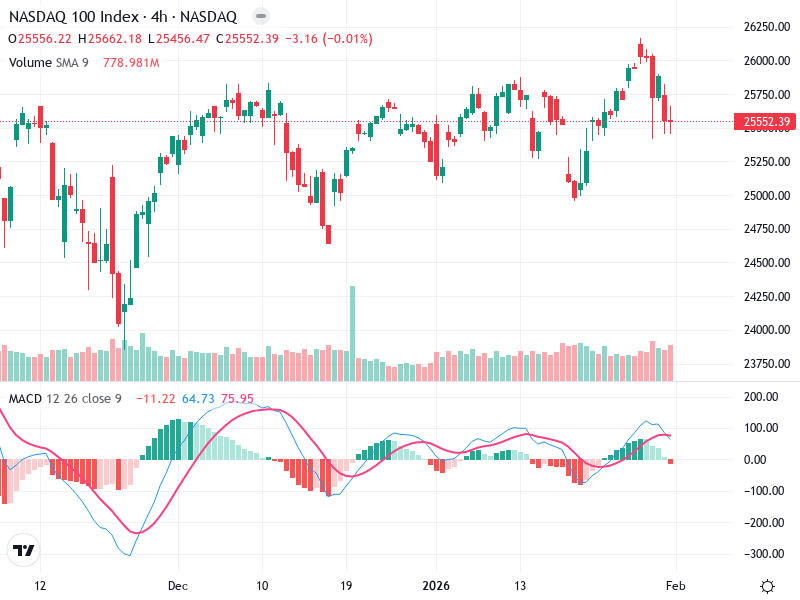
Key Resistance: Around 26,000, which recently acted as a ceiling.

Potential Support: Around 25,000, which aligns with previous consolidation areas and may serve as a buying zone if tested.

These levels are crucial for determining potential reversals or continuation patterns.

Actionable Insights

Buying Opportunity: Consider buying if the index approaches the 25,000 support and shows reversal patterns with increased volume.

Selling Strategy: Current momentum suggests holding off until a clear reversal signal arises if holding long positions.

A wait-and-see approach is advisable until the index establishes a clear direction.

The AI Technical Analysis Center is an informational tool only and does not constitute investment or trading advice.
This site is registered on wpml.org as a development site. Switch to a production site key to remove this banner.