Generic selectors
Exact matches only
Search in title
Search in content
Post Type Selectors

Popular stocks

Crypto

CFD

Currencies

Support

Gold

NZD/USD – Technical Analysis – 4h

February 2, 2026 13:00

Quick Summary

The chart for the NZD/USD 4H timeframe exhibits an ongoing evaluation of price movements and potential shifts in trend. The asset is currently in a phase where key levels are being tested, providing crucial insights for traders.

With the current market dynamics, the analysis reveals pivotal points of interest that may influence upcoming trading decisions.

Candlestick Analysis

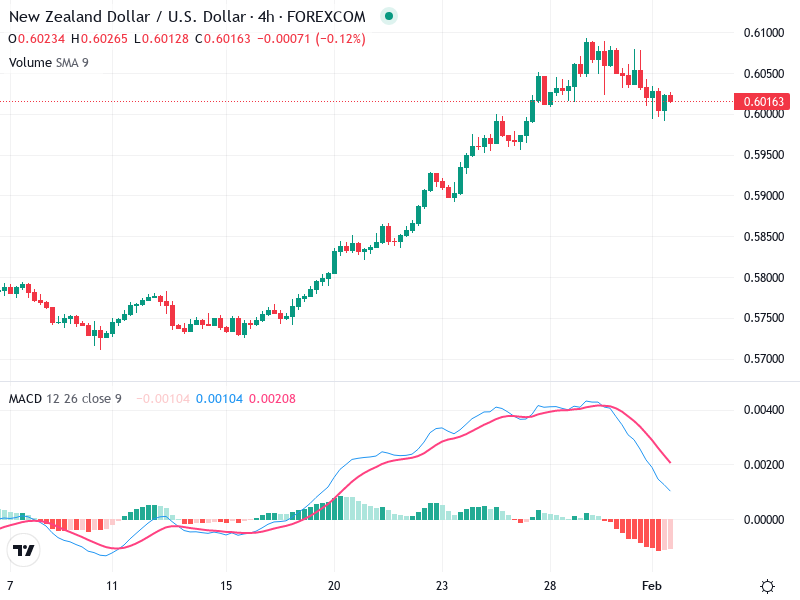
The chart shows a recent bullish trend followed by a potential consolidation or pullback.

Toward the peak, small-bodied candles suggest indecision, possibly indicating doji patterns.

The area around 0.60500 acted as a resistance, and recent candles are showing pullback signs.

MACD Analysis

The MACD line is below the Signal line, indicating a bearish crossover.

Negative values in the histogram reflect growing bearish momentum.

Currently, no clear divergences; the MACD is aligning with recent bearish price movements.

Volume Analysis

Volume appears to decrease, which can indicate a weakening of the trend.

Low volume on declines suggests lack of strong conviction among sellers.

No significant volume spikes, indicating absence of pronounced institutional activity.

Support & Resistance

Around 0.60000, acting as a psychological level and previous support.

Recent rejection near 0.60500 suggests a strong resistance zone.

Actionable Insights

Monitor for support at 0.60000.

Look for bullish reversal patterns around 0.60000 for a possible buy.

Further breakdown below 0.60000 with high volume may warrant sell signals.

The AI Technical Analysis Center is an informational tool only and does not constitute investment or trading advice.
This site is registered on wpml.org as a development site. Switch to a production site key to remove this banner.