Generic selectors
Exact matches only
Search in title
Search in content
Post Type Selectors

Popular stocks

Crypto

CFD

Currencies

Support

Gold

GBP/USD – Technical Analysis – 4h

February 2, 2026 13:04

Quick Summary

The chart reflects a pullback within an overall bullish trend for GBP/USD . A crucial support level is being tested, which may dictate future price movements.

The asset’s direction is presently bearish, as indicated by various technical factors.

Candlestick Analysis

The chart shows an overall bullish trend with a recent pullback from a peak.

A prominent bullish trend is evident, but recently there’s been a series of bearish candlesticks indicating a pullback.

The recent high around 1.3850 marks a resistance zone, and the area near 1.3700 acts as a potential support following the pullback.

MACD Analysis

The MACD line has crossed below the Signal line, indicating a bearish crossover.

The histogram is negative and increasing in magnitude, suggesting growing bearish momentum.

No clear divergences noted between the MACD and price action, aligning with current bearish sentiment.

Volume Analysis

A moderate increase in volume corresponds with the recent price decline, supporting the bearish move.

No significant spikes suggesting strong institutional activity at this time.

The volume trends align with the ongoing bearish sentiment observed in other indicators.

Support & Resistance

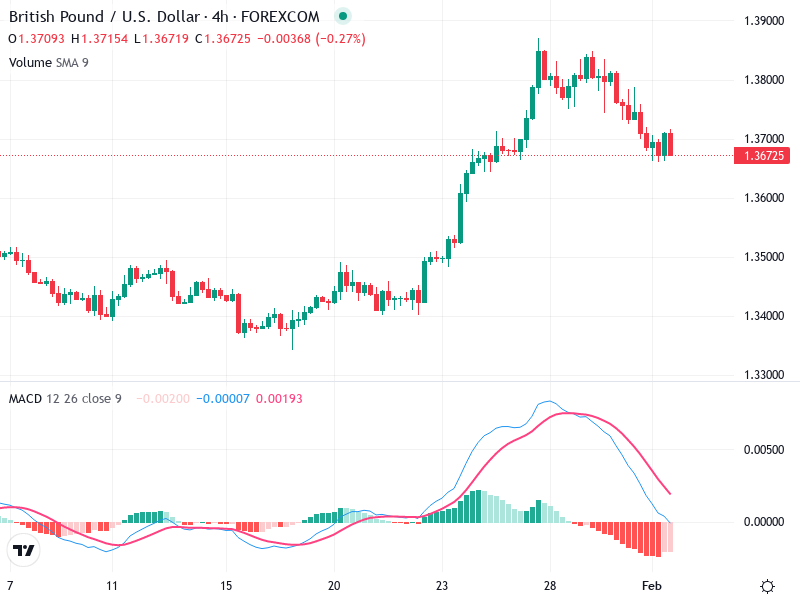
Resistance is seen around 1.3850, where the price peaked before the pullback.

Support is near 1.3670 to 1.3700, a critical zone to watch for a potential reversal or continuation of the downtrend.

The market may find strong resistance or support at these levels, influencing future price directions.

Actionable Insights

Consider short positions below 1.3670 if the support is breached with increased volume, signifying continued bearish momentum.

Only consider buying if the price shows a reversal pattern around 1.3670 with a bullish candlestick formation.

Watch for continued signs of bearish momentum or any reversal candlestick patterns near support for buy signals.

The AI Technical Analysis Center is an informational tool only and does not constitute investment or trading advice.
This site is registered on wpml.org as a development site. Switch to a production site key to remove this banner.