Generic selectors
Exact matches only
Search in title
Search in content
Post Type Selectors

Popular stocks

Crypto

CFD

Currencies

Support

Gold

NSDQ – Technical Analysis – 4h

February 3, 2026 08:00

Quick Summary

The chart indicates a mix of bullish and bearish signals for . Breakout patterns and volume spikes are particularly notable, providing intriguing insights into potential asset movements.

Observing these technical indicators can offer valuable guidance for trading strategies on .

Candlestick Analysis

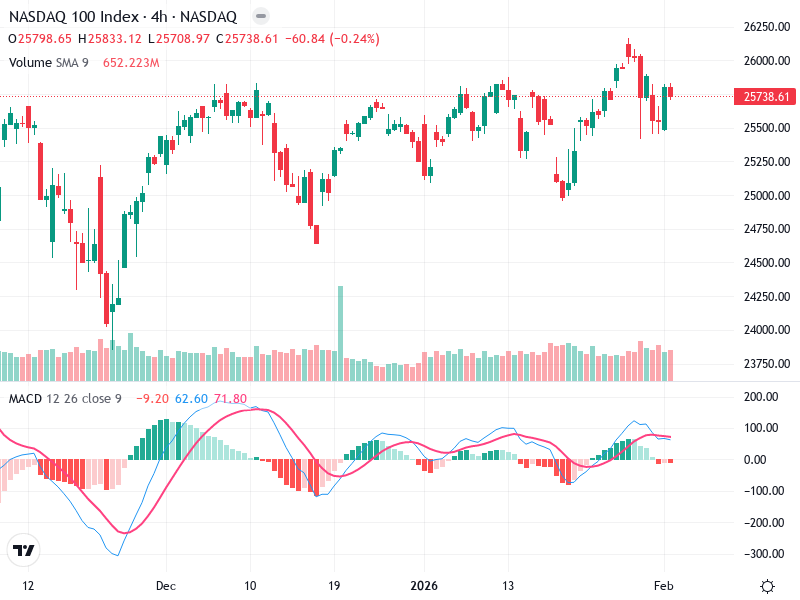
Recent candlesticks display a mix of bullish and bearish signs, with a prominent bearish engulfing pattern suggesting possible short-term downward pressure.

The medium-term trend appears bullish with higher highs and lows, but recent pullbacks advise caution.

Encountered pullback after nearing the resistance at 26,000 indicates a potential reaction point.

MACD Analysis

The MACD line is currently above the Signal line, yet showing signs of convergence, hinting at weakening bullish momentum.

The declining positive bars on the histogram corroborate the weakening momentum observation.

No clear MACD and price action divergences now, but staying alert for potential trajectory changes is advisable.

Volume Analysis

Previously, a notable volume spike linked to an upward move showed strong buying interest.

Recent bearish candles align with moderate volume levels, indicating weak selling pressure.

The earlier volume spike might reflect institutional activity, aligning with the bullish period then.

Support & Resistance

Around 25,500 is critical support, previously tested and holding strong as recent support.

The 26,000 mark represents a significant resistance zone.

Observing changes in these key levels could offer insights into future movements.

Actionable Insights

A cautious hold strategy is advisable, awaiting further MACD and candlestick pattern confirmations.

Risk-takers might consider long positions around the 25,500 support with tight stop-losses.

Monitoring potential MACD bearish crossover and volume changes near key levels is crucial for further strategy alignment.

The AI Technical Analysis Center is an informational tool only and does not constitute investment or trading advice.
This site is registered on wpml.org as a development site. Switch to a production site key to remove this banner.