Generic selectors
Exact matches only
Search in title
Search in content
Post Type Selectors

Popular stocks

Crypto

CFD

Currencies

Support

Gold

GBP/USD – Technical Analysis – 4h

February 4, 2026 13:04

Quick Summary

This chart presents an insightful overview of , highlighting significant trends and potential breakout zones. Analysis indicates noticeable levels where buyers and sellers have taken positions, providing potential strategic trading opportunities. In the following analysis, we delve deep into various technical indicators.

Candlestick Analysis

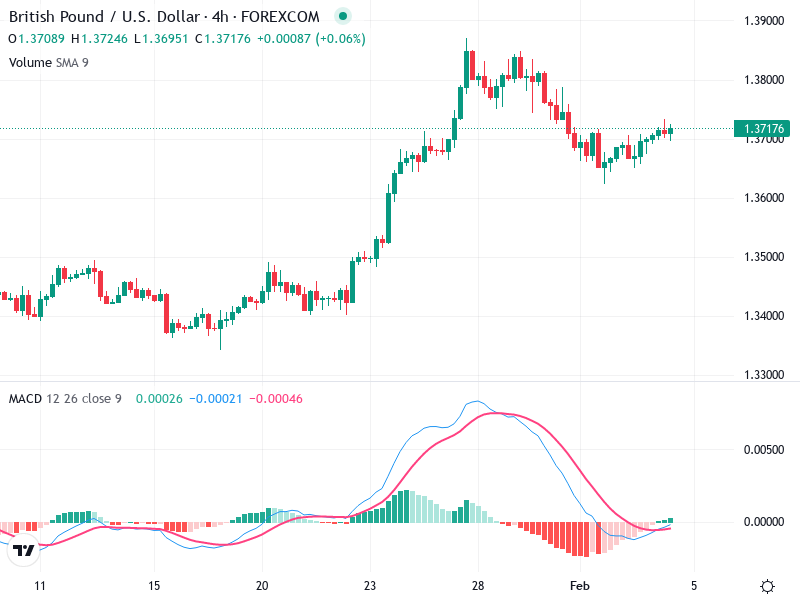
The chart shows a prominent uptrend followed by a consolidation phase. Several bullish candlestick patterns, such as a large bullish candle around January 23, indicate strong buying interest.

Initially, the trend is bullish, with strong upward momentum. Recently, it appears to have entered a sideways consolidation phase after the peak.

The peak around 1.38000 suggests a strong resistance zone. The recent consolidation around 1.37000 could act as a breakout or pullback zone.

MACD Analysis

There's a recent bullish crossover as the MACD line crosses above the signal line. This indicates potential bullish momentum.

The histogram has shifted from negative to positive, confirming the possibility of a bullish trend resumption.

No clear divergences between the MACD and price action at present.

Volume Analysis

Volume increased significantly during the initial uptrend, supporting the price rise. It has reduced during the consolidation phase.

Lower volume in the sideways movement suggests indecision among traders, which aligns with the consolidation pattern.

No substantial unusual spikes are visible, implying limited institutional activity recently.

Support & Resistance

Resistance is around 1.38000 as evidenced by multiple rejections at this level.

The 1.36000 level is a notable support, serving as a base during recent consolidations.

These levels define the key range for current price movements.

Actionable Insights

Consider buying if the price breaks above 1.38000 with increased volume, signaling a continuation of the bullish trend.

A breakdown below 1.36000 with accompanying volume may indicate a potential bearish reversal.

If price remains within the 1.36000 to 1.38000 range, a hold strategy could be considered while awaiting a clearer trend direction.

The AI Technical Analysis Center is an informational tool only and does not constitute investment or trading advice.
This site is registered on wpml.org as a development site. Switch to a production site key to remove this banner.