Generic selectors
Exact matches only
Search in title
Search in content
Post Type Selectors

Popular stocks

Crypto

CFD

Currencies

Support

Gold

GOLD – Technical Analysis – 4h

February 4, 2026 17:02

Quick Summary

The gold Futures 4-hour chart shows interesting patterns with recent bearish activity. Despite a strong uptrend, there’s a notable pullback, indicating a potential correction phase. Both traders and investors are closely watching the critical resistance and support levels.

The asset shows signs of cautious bearishness post the latest drop, with the broader trend showing potential consolidation.

Candlestick Analysis

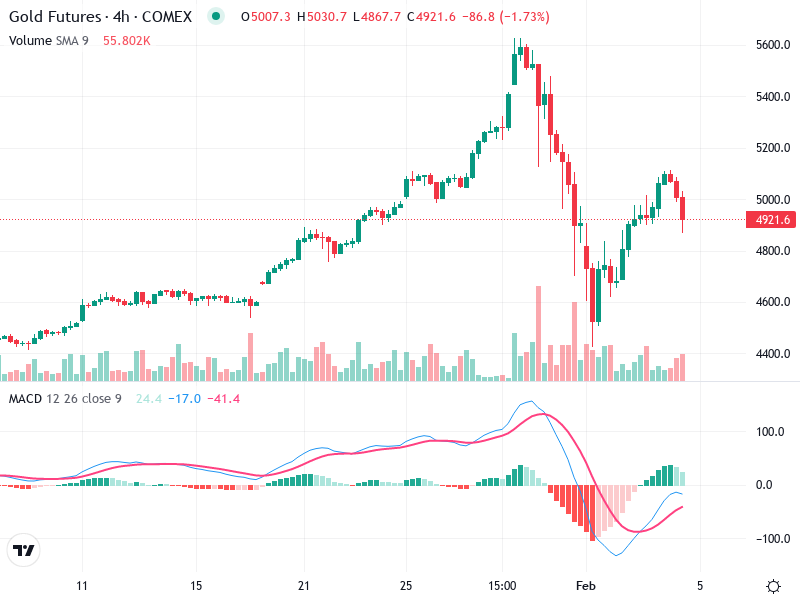
Recently, there is a bearish candlestick following a series of bullish ones, indicating potential resistance around the 5000 level.

Prior to the sharp drop, a series of smaller green candles mark gradual upward movement indicating a potential exhaustion.

The trend was bullish until late January, with a significant pullback occurring at the end of the month. Currently, it seems to be in a correction phase.

MACD Analysis

The MACD line has crossed below the Signal line, indicating a bearish crossover and potential downward momentum.

The histogram shows increasing red bars, suggesting growing bearish momentum.

While the price made higher highs previously, the MACD did not follow, indicating a bearish divergence.

Volume Analysis

Significant volume spikes are seen during the recent drop, possibly indicating strong selling pressure or institutional involvement.

The large red volume bar during the drop shows strong confirmation of bearish sentiment.

Prior spikes in volume during bull runs indicate buying interest, which shifted drastically during the recent fall.

Support & Resistance

Key support seen around the 4700 level, where the price previously bounced back.

Strong resistance is evident around 5000, as noted by the hesitance in breaking this level.

Breaking through 5000 could reignite bullish momentum, while failing to hold above 4700 may lead to further declines.

Actionable Insights

Traders could consider selling if the price fails to hold above 5000, with a stop-loss around 5050 to manage risk.

Watch for a clear breakout above 5050 as a buy signal.

Observe for confirmation signals at support and resistance levels. A strong push past resistance with volume confirmation would be bullish.

The AI Technical Analysis Center is an informational tool only and does not constitute investment or trading advice.
This site is registered on wpml.org as a development site. Switch to a production site key to remove this banner.