Generic selectors
Exact matches only
Search in title
Search in content
Post Type Selectors

Popular stocks

Crypto

CFD

Currencies

Support

Gold

NSDQ – Technical Analysis – 4h

February 5, 2026 08:00

Quick Summary

The chart reflects a strong downward trend, intensified by recent large bearish candles.

faces significant downward pressure with potential rebounds near strategic support levels.

Candlestick Analysis

The chart shows a downward trend overall, with recent large bearish candles indicating strong selling pressure.

A notable bearish engulfing pattern is visible in the recent candles, suggesting continued bearish sentiment.

A hammer pattern near the end of the chart indicates potential reversal or support around current levels, as buyers stepped in after significant selling.

MACD Analysis

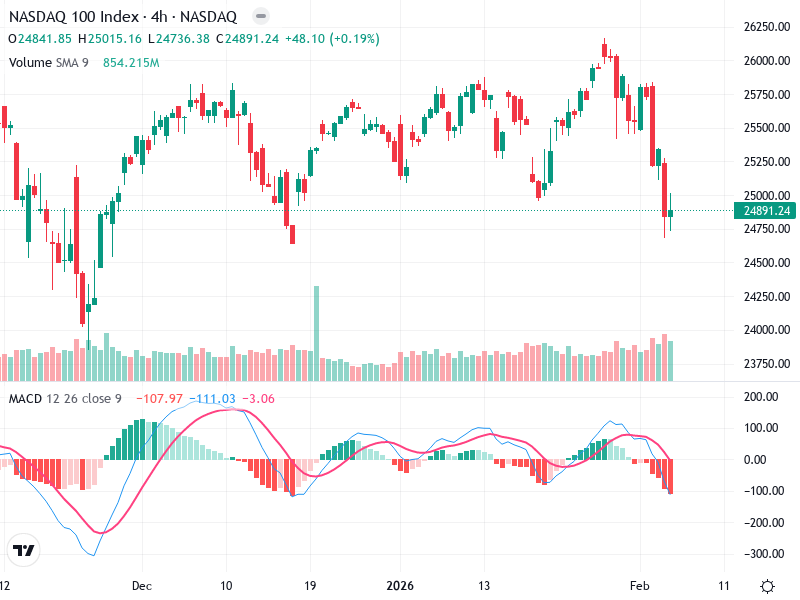
The MACD line is below the Signal line, indicating a bearish crossover that happened recently, suggesting negative momentum.

The MACD histogram shows increasing negative bars, which further confirms bearish momentum and a lack of buying pressure.

No significant divergences are noted between MACD and price action, reinforcing the current downtrend.

Volume Analysis

There is a noticeable increase in volume during the recent decline, supporting the strength of the bearish move.

A large spike in volume a few days ago coincided with a significant price drop, possibly indicating institutional selling or panic selling.

Support & Resistance

Key support is around the 24,500 level, where the recent price action shows a potential bounce, the hammer formation adds strength to this support.

Previous support around 25,000 now acts as resistance.

The ability of the price to break above this level is crucial for any reversal to hold.

Actionable Insights

Given the strong bearish signals, it might be prudent to hold off new buys until a clear reversal signal forms.

Existing long positions could consider risk management strategies.

Watch for confirmation of reversal with a close above 25,000, accompanied by decreasing selling volume.

The AI Technical Analysis Center is an informational tool only and does not constitute investment or trading advice.
This site is registered on wpml.org as a development site. Switch to a production site key to remove this banner.