Generic selectors
Exact matches only
Search in title
Search in content
Post Type Selectors

Popular stocks

Crypto

CFD

Currencies

Support

Gold

GOLD – Technical Analysis – 4h

February 5, 2026 17:03

Quick Summary

The gold Futures chart shows recent market activities and key levels to watch. There’s an observable current phase after a recent downtrend and attempted recovery. Critical patterns and momentum indicators provide insights into potential price movements.

Candlestick Analysis

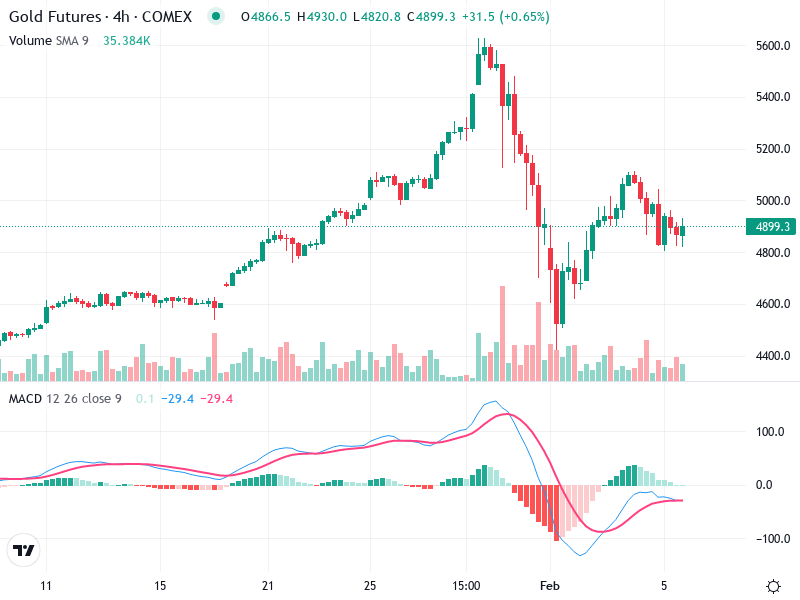
There is a notable downtrend followed by a potential reversal pattern that includes a series of smaller-bodied candles, suggesting indecision. A Doji pattern is also visible, which indicates potential reversal or consolidation.

The chart shows a recent bearish trend with a subsequent recovery, now in a sideways/consolidation phase.

Key breakout zone is around the 5000 level, while the support zone is around 4850.

MACD Analysis

The MACD line is very close to the Signal line, indicating caution. There is a recent bullish crossover suggesting potential upward momentum but it remains weak.

The histogram shows weakening momentum, as it is close to the zero line after a bullish crossover.

There are no clear divergences between the MACD and the price action at this moment.

Volume Analysis

The volume peaked during the initial downtrend, indicating strong selling pressure. Current volume is declining, indicating reduced participation or a lack of strong conviction in price direction.

The price rise is accompanied by decreasing volume, which weakens the case for a strong bullish move without further volume validation.

Current volume behavior underscores the need for volume confirmation for any significant price movement.

Support & Resistance

Around the 4800 mark is a key level to watch for potential support.

The region near 5000 acts as resistance and a breakout above it could signify a continuation of the upward trend.

Monitoring these levels helps in identifying potential entry and exit points.

Actionable Insights

Consider a cautious buy if the price breaks above 5000 with increased volume, using the 4850 area as a stop-loss zone.

A sell strategy could be employed if the price breaks below 4800, especially if accompanied by a volume increase.

Look for confirmation signals, such as a strong bullish or bearish candlestick formation with volume support or a further MACD signal line crossover.

The AI Technical Analysis Center is an informational tool only and does not constitute investment or trading advice.
This site is registered on wpml.org as a development site. Switch to a production site key to remove this banner.