Generic selectors
Exact matches only
Search in title
Search in content
Post Type Selectors

Popular stocks

Crypto

CFD

Currencies

Support

Gold

NSDQ – Technical Analysis – 4h

February 6, 2026 08:01

Quick Summary

The NASDAQ 100 Index has been experiencing a notable downtrend characterized by lower highs and lower lows.

The index is currently testing a critical support level, which might act as a turning point.

Overall, the prevailing market sentiment is bearish, with a close watch needed for any possible reversal signs.

Candlestick Analysis

The current trend appears bearish, marked by a series of lower highs and lower lows in the recent sessions.

A notable pattern is the potential formation of a hammer at the most recent candle, indicating possible bullish reversal if confirmed.

The index seems to be testing a previous support zone around 24,500, which could act as a pivot for reversal or further decline.

MACD Analysis

The MACD line is below the Signal line, indicating a bearish crossover, which suggests continuing downside momentum.

The MACD histogram is in negative territory but shows signs of reducing negative momentum, potentially hinting at a slowing down of the bearish trend.

No clear divergences observed between MACD and price action currently.

Volume Analysis

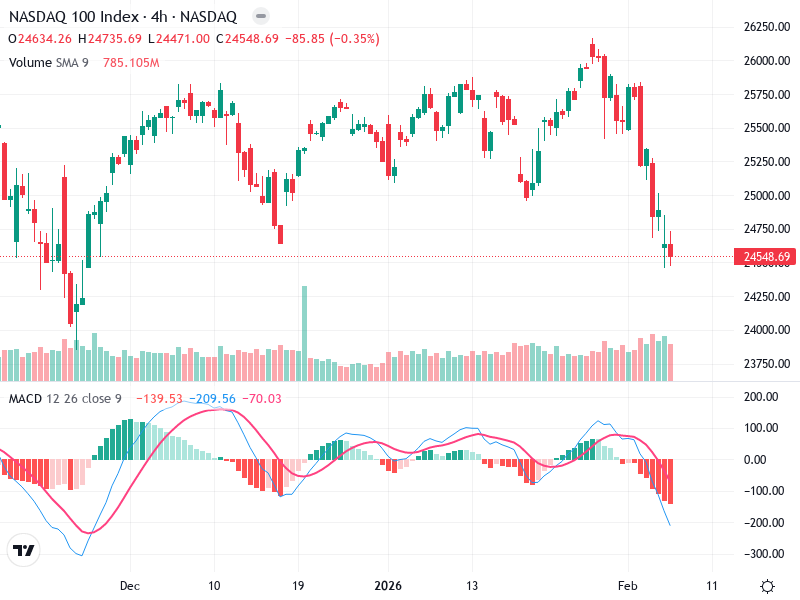
There was a noticeable spike in volume during the recent downtrend, indicating strong selling pressure. However, recent volume appears to taper off slightly, suggesting reduced momentum.

The increase in volume supports the bearish price movement, confirming the recent decline may have been driven by significant market participation.

The large volume spikes may entail institutional selling, contributing to the downward pressure.

Support & Resistance

Key support is identified around 24,500, a previous point of consolidation where the price is currently testing.

Near-term resistance is around 25,700, where recent retracements faced selling pressure.

Breaching the 24,500 support could lead to further declines, while a bounce could trigger a reversal.

Actionable Insights

Consider buying if there's a confirmed reversal pattern, such as a bullish candlestick confirmation, above 24,500.

A break below 24,500 with increasing volume might warrant a sell or short position.

If uncertain, observing for clearer signals at critical support/resistance levels is prudent.

The AI Technical Analysis Center is an informational tool only and does not constitute investment or trading advice.
This site is registered on wpml.org as a development site. Switch to a production site key to remove this banner.