Generic selectors
Exact matches only
Search in title
Search in content
Post Type Selectors

Popular stocks

Crypto

CFD

Currencies

Support

Gold

NZD/USD – Technical Analysis – 4h

February 6, 2026 13:01

Quick Summary

The chart for NZD/USD showcases a recent shift in momentum, highlighting key levels of interest. Initially bullish, the trend now presents corrective signals. The asset is trading near pivotal levels of resistance, drawing attention to its potential next moves.

Candlestick Analysis

The chart shows an initial strong bullish trend followed by a visible correction phase.

Around February 5, there's a possible formation of a doji or hammer-like pattern, indicating potential indecision or a reversal.

The 0.61000 level appears to be a recent high where the price reversed, suggesting its importance as a resistance zone.

MACD Analysis

The MACD line (blue) has recently crossed above the Signal line (red) at the current time, indicating a potential bullish reversal.

The histogram is moving towards the zero line from a negative value, suggesting weakening bearish momentum.

No significant divergences between MACD and price are apparent currently.

Volume Analysis

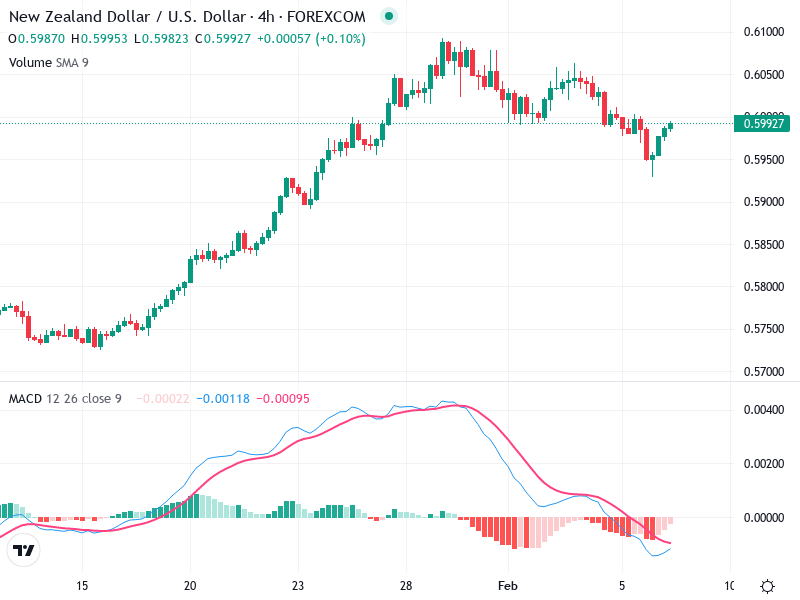
Volume seems relatively steady with no dramatic spikes, implying consistent trading activity without institutional moves.

Lack of volume spikes implies that recent price movements aren't supported by strong buying/selling pressure, suggesting possible short-term traps.

This volume behavior points to potential hesitation in either direction, making it crucial to wait for confirmation.

Support & Resistance

The area around 0.58500 serves as a potential support level where the recent pullback found some buying interest.

The 0.61000 level is a key resistance point.

Watch for price action within these levels to gauge future movements.

Actionable Insights

Consider entering a cautious long position if the price stabilizes above 0.60000 and the MACD maintains a bullish crossover. A stop-loss order can be placed below the recent low at 0.58500.

A failure to break above 0.60000 with increasing volume might suggest a short opportunity, targeting the 0.58500 support area.

If the price remains indecisive around 0.60000 without clear volume support, consider holding off on trades until clearer signals emerge.

The AI Technical Analysis Center is an informational tool only and does not constitute investment or trading advice.
This site is registered on wpml.org as a development site. Switch to a production site key to remove this banner.