Generic selectors
Exact matches only
Search in title
Search in content
Post Type Selectors

Popular stocks

Crypto

CFD

Currencies

Support

Gold

GBP/USD – Technical Analysis – 4h

February 6, 2026 13:04

Quick Summary

The chart of the asset reflects a complex mix of movements. Recent trends show changes that could alter investor strategies. The asset displays a mixture of signs that analysts should scrutinize closely.

Candlestick Analysis

The chart shows a recent downtrend following a pronounced uptrend, indicating a possible bearish sentiment after reaching a peak.

No distinct classic candlestick patterns like engulfing or doji are visible near this timeframe’s current price, but recent green candles suggest a potential attempt at a reversal or consolidation after a downtrend.

A key pullback zone appears around 1.3580, where the price has consolidated after the recent decline.

MACD Analysis

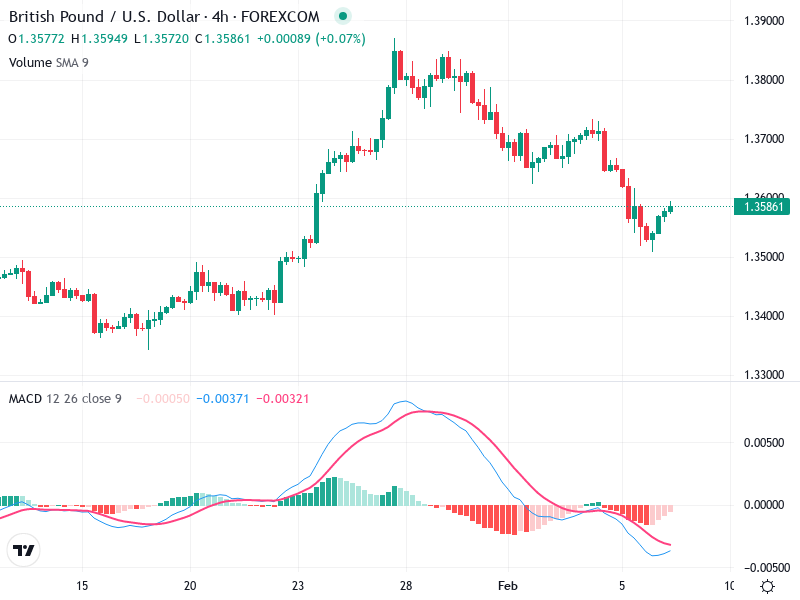
Currently, the MACD line is very close to the Signal line. The slight proximity looks like the start of a bullish crossover, indicating potential upward momentum if confirmed.

The histogram shows increasing green bars, suggesting that the bearish momentum is waning, and bullish pressure might be building.

No clear divergence is visible at this point between MACD and price action, but the recent alignment hints at a possible shift in trend.

Volume Analysis

The chart shows relatively stable volume without significant spikes, indicating that the recent movements aren't strongly supported by high trading activity.

The low volume during the current price rise suggests caution as it might imply a weak bullish attempt so far.

No noticeable volume spikes indicating institutional activity are present.

Support & Resistance

The nearest support level is around 1.3500, where previous price consolidation occurred.

Immediate resistance can be expected around the 1.3700 level, which coincides with previous peaks and reaction highs.

Monitoring these levels could provide critical insights into future price movements.

Actionable Insights

Consider waiting for a confirmed bullish crossover on the MACD alongside increased volume to validate buying pressure.

Observe for rejection at the resistance level (1.3700) or a bearish MACD crossover if the price fails to continue upward.

Holding might be suitable if already positioned, while watching for confirmation signals that validate the onset of a new trend.

The AI Technical Analysis Center is an informational tool only and does not constitute investment or trading advice.
This site is registered on wpml.org as a development site. Switch to a production site key to remove this banner.