Generic selectors
Exact matches only
Search in title
Search in content
Post Type Selectors

Popular stocks

Crypto

CFD

Currencies

Support

Gold

GBP/USD – Technical Analysis – 4h

February 9, 2026 13:04

Quick Summary

The GBP/USD 4-hour chart indicates potential bullish momentum as it rebounds from recent lows. Key levels around 1.3600 and 1.3700 are crucial in determining the next price direction.

The asset demonstrates signs of recovery amid changing market sentiment.

Candlestick Analysis

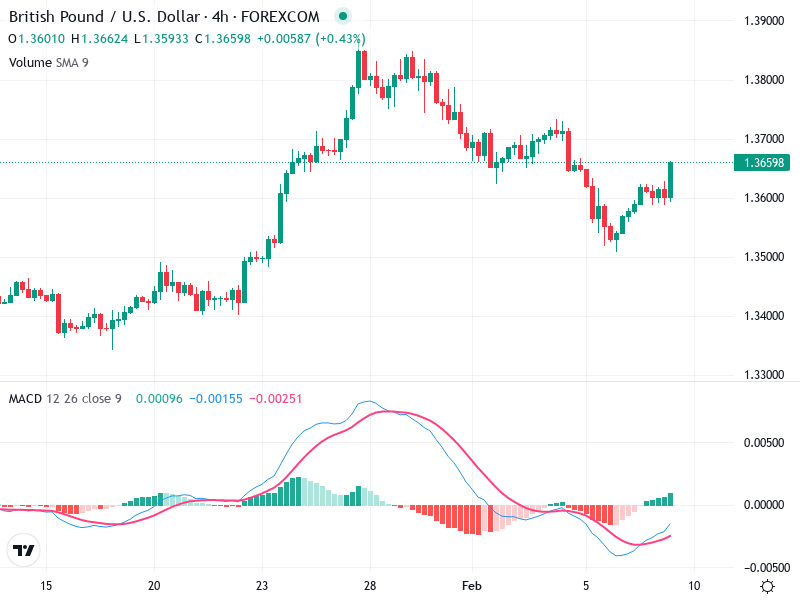
Recently, there's a potential bullish reversal indicated by the green candlestick following several red ones, akin to a hammer pattern, suggesting buying pressure near the lows.

Initially bullish but has shown a recent bearish correction. Currently attempting to rebound from recent lows.

The area near 1.3600 acted as a resistance and may now serve as a support level indicating a potential pullback zone.

MACD Analysis

A bullish crossover appears to be forming as the MACD line starts to move above the Signal line. This suggests potential upward momentum.

Showing decreasing negative bars, indicating waning bearish momentum and a possible shift towards bullish sentiment.

No significant divergences noted currently between MACD and price action, supporting the short-term upward movement.

Volume Analysis

Volume appears slightly diminished during the recent downtrend but shows a small uptick correlating with the bullish candlestick, suggesting some buying interest at this level.

Increasing volume on the bullish candlestick supports the validity of the potential reversal.

No significant spikes indicating institutional activity currently.

Support & Resistance

Around 1.3600 is a key support zone, previously resistance; this level is crucial for maintaining upward momentum.

Near 1.3700 is a key resistance where price previously peaked and turned down.

Watch for price action around this level.

Actionable Insights

Consider buying near 1.3600, confirming with further bullish candlesticks or a MACD crossover.

Potential selling opportunity if price fails to break above 1.3700 with close monitoring of volume decreases on down moves.

Hold as price approaches 1.3700 resistance, waiting for a decisive breakout or rejection.

The AI Technical Analysis Center is an informational tool only and does not constitute investment or trading advice.
This site is registered on wpml.org as a development site. Switch to a production site key to remove this banner.