Generic selectors
Exact matches only
Search in title
Search in content
Post Type Selectors

Popular stocks

Crypto

CFD

Currencies

Support

Gold

GOLD – Technical Analysis – 4h

February 9, 2026 17:02

Quick Summary

The chart presents a comprehensive view of the market dynamics, highlighting key technical indicators and patterns.

It reflects a strong focus on recent price movements and market sentiment, essential for informed decision-making.

Volatility and significant price changes around certain levels are noticeable.

Candlestick Analysis

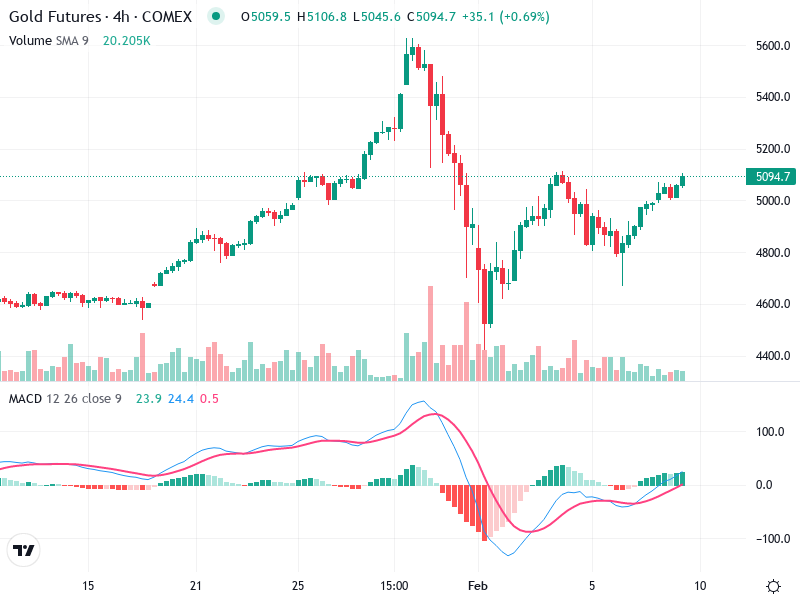
The chart shows an initial bullish trend with strong upward movement, followed by a sharp decline, and then a recovery attempt.

There is a visible bullish engulfing pattern near the bottom of the retracement, indicating potential reversal.

The formation of long wicks at the top during the peak suggests selling pressure and potential reversal during that period.

MACD Analysis

The MACD line is above the Signal line, indicating a bullish crossover has recently occurred.

The histogram has shifted from negative to positive territory, suggesting increasing bullish momentum.

No significant divergences are noted at this time between MACD and price action; both reflect bullish sentiment.

Volume Analysis

An increase in trading volume is noticeable during the price dip and subsequent recovery, suggesting strong market interest and participation.

The rising volume supports the price increase, indicating conviction in the upward move.

The spikes during the decline and recovery suggest possible institutional activity.

Support & Resistance

The 5000 level acts as a strong support after the recent breakout.

The area around 5200 serves as a resistance that needs to be broken for continued upward movement.

Monitoring these levels is essential for anticipating potential market shifts.

Actionable Insights

Consider buying on a confirmed close above the 5200 resistance, supported by high volume.

A failure to hold the 5000 support level with increased selling volume could indicate a potential sell opportunity.

Monitor for consolidation between 5000 and 5200 for potential breakout direction.

The AI Technical Analysis Center is an informational tool only and does not constitute investment or trading advice.
This site is registered on wpml.org as a development site. Switch to a production site key to remove this banner.