Generic selectors
Exact matches only
Search in title
Search in content
Post Type Selectors

Popular stocks

Crypto

CFD

Currencies

Support

Gold

NZD/USD – Technical Analysis – 4h

February 10, 2026 13:00

Quick Summary

The chart shows a recent consolidation after a prior bullish trend, indicating some indecision in the market. Key levels around 0.605 and 0.600 will be critical for future price action. Observing volume alongside these levels could provide actionable insights.

Candlestick Analysis

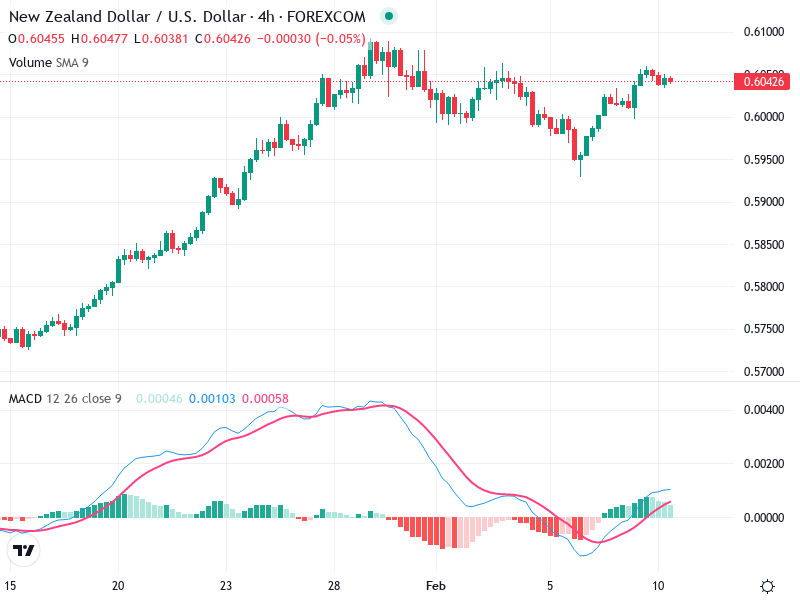
The overall trend has recently shifted from bullish to sideways, as indicated by the consolidation at the top after a strong upward movement.

Look for patterns like doji or small-bodied candles, which suggest indecision and the potential for a reversal or continuation.

There is a potential breakout zone around the 0.605 level. A close above this could signify a continuation of the previous bullish trend.

MACD Analysis

The MACD line is crossing above the Signal line, indicating a potential bullish reversal or continuation.

The histogram is turning positive, suggesting increasing bullish momentum.

No significant divergence observed between the MACD and price action currently.

Volume Analysis

Volume has decreased from high levels during the upward trend, suggesting the prior bullish momentum might be weakening.

The lower volume during the sideways movement can indicate a lack of conviction for both bulls and bears.

No unusual spikes in volume to suggest major institutional activity recently.

Support & Resistance

Support: Around 0.600 to 0.595- these levels have held previously and could provide a floor.

Resistance: Near 0.605-0.610; breaking through this level with strong volume could lead to a further uptrend.

Actionable Insights

Consider a buy if price closes above the 0.605 level with increased volume, which would indicate strength and the continuation of the bullish trend.

Monitor for a breakdown below 0.600 with strong volume as a potential sell signal due to a shift in the short-term trend.

Market Sentiment: Neutral to slightly bullish based on MACD's positive movement but requires confirmation from volume and price action.

The AI Technical Analysis Center is an informational tool only and does not constitute investment or trading advice.
This site is registered on wpml.org as a development site. Switch to a production site key to remove this banner.