Generic selectors
Exact matches only
Search in title
Search in content
Post Type Selectors

Popular stocks

Crypto

CFD

Currencies

Support

Gold

AUD/USD – Technical Analysis – 4h

February 10, 2026 13:02

Quick Summary

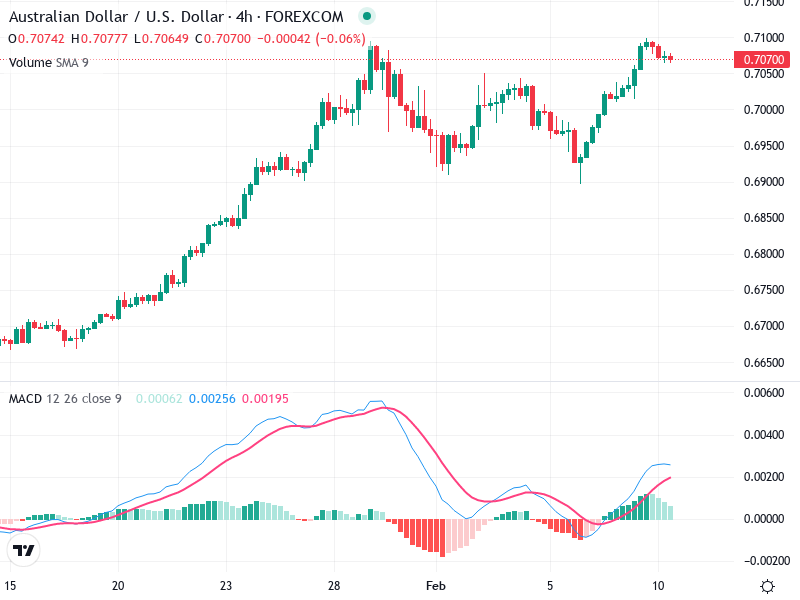
The AUD/USD 4-hour chart is showing signs of a bullish trend with recent consolidation near resistance levels. The asset has been testing its resistance, which indicates potential for further movement.

The currency pair has experienced a bullish rally, followed by some pullback, which suggests a possible continuation of the trend. Investors should remain cautious as the chart has also shown signs of indecisiveness.

Candlestick Analysis

The chart exhibits a strong bullish rally leading up to late January.

There is a noticeable pullback followed by another advance, indicating possible continuation of the trend.

Recently, small-bodied candles near the top signify indecision and a potential reversal.

MACD Analysis

The MACD line is above the signal line, showing a bullish crossover.

Positive histogram values are rising, suggesting an increase in bullish momentum.

No significant divergence is observed between the MACD and the price action at this time.

Volume Analysis

Volume trends indicate a decrease during the consolidation, suggesting weaker participation in trading.

This declining volume confirms the recent price consolidation, marking a lack of strong conviction.

There are no unusual volume spikes that suggest strong institutional activity currently.

Support & Resistance

Resistance is identified around 0.7100, which is being tested by current price action.

Immediate support lies near 0.7050, with stronger support below at 0.7000.

Observing these key levels can provide insights into potential price movements.

Actionable Insights

Consider buying if the price closes above 0.7100 with increased volume, indicating a breakout.

Watch for bearish candlestick confirmation or a MACD bearish crossover to short below 0.7050.

If indecision persists without significant volume increase, holding or reducing exposure may be prudent.

The AI Technical Analysis Center is an informational tool only and does not constitute investment or trading advice.
This site is registered on wpml.org as a development site. Switch to a production site key to remove this banner.