Generic selectors
Exact matches only
Search in title
Search in content
Post Type Selectors

Popular stocks

Crypto

CFD

Currencies

Support

Gold

GBP/USD – Technical Analysis – 4h

February 10, 2026 13:04

Quick Summary

The chart for shows significant movement, indicating potential trading opportunities. Analyzing the chart reveals clear areas of support and resistance, which are crucial for short-term market decisions.

The recent trends suggest a possible bullish momentum with key factors in play.

Candlestick Analysis

The chart shows a recent overall bullish trend with a noticeable uptrend from mid-January to February, followed by a correction.

A potential bullish engulfing pattern appears before the recent upward move, indicating a reversal from the prior downtrend.

The area around 1.3700 is a recent pullback zone where the price struggled, indicating potential resistance.

MACD Analysis

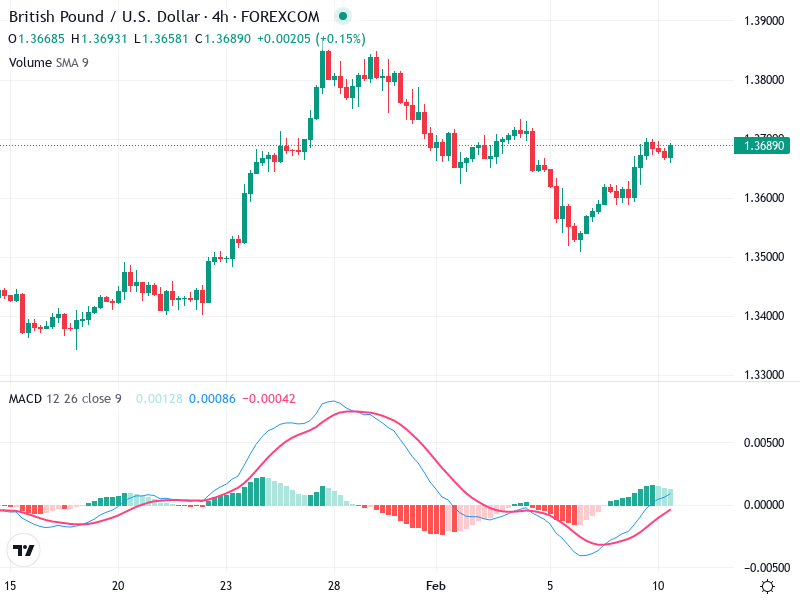
There is a recent bullish crossover, where the MACD line has crossed above the Signal line, indicating potential upward momentum.

The histogram has shifted from negative to positive, supporting potential positive momentum and a bullish outlook.

No clear divergence is observed between price action and the MACD, which aligns the indicator with the price trend.

Volume Analysis

There were significant volume spikes during the initial uptrend, which supported the price increase.

Sharp volume increases could suggest institutional buying, especially noticeable during trend reversals.

Current price movements are moderately supported by volume, but a lack of strong volume on corrections may suggest weak bearish sentiment.

Support & Resistance

Key support around 1.3500 could serve as a base if the price declines.

The recent area around 1.3750-1.3800 is critical as resistance, potentially limiting further upward movements in the short term.

Actionable Insights

Consider buying if the price breaks above 1.3750 with strong volume, confirming the bullish momentum.

If the price drops below 1.3500 with increasing volume, look for selling opportunities as it could indicate bearish strength.

Holding is advisable while awaiting a breakout confirmation past resistance or a clear breach of support.

The AI Technical Analysis Center is an informational tool only and does not constitute investment or trading advice.
This site is registered on wpml.org as a development site. Switch to a production site key to remove this banner.