Generic selectors
Exact matches only
Search in title
Search in content
Post Type Selectors

Popular stocks

Crypto

CFD

Currencies

Support

Gold

NSDQ – Technical Analysis – 4h

February 11, 2026 08:01

Quick Summary

The NASDAQ 100 chart highlights a potential shift in market sentiment with technical indicators suggesting a possible recovery from a recent bearish trend.

Key levels are being tested, and upcoming movements could be critical in setting the direction for the index.

Candlestick Analysis

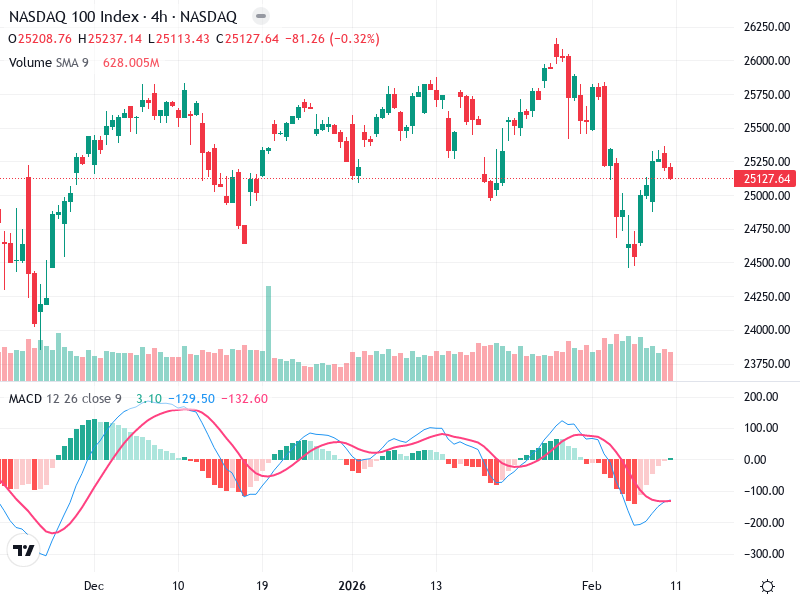
The chart shows a recent bearish trend with a possible reversal as there is a formation of higher lows and higher highs following a recent dip.

There's a noticeable bullish engulfing pattern near the recent low, indicating a potential reversal. Some small doji candles appear, suggesting indecision at these levels.

A breakout above 25,250 could signal further upward movement, while support near 24,750 could serve as a critical pullback level.

MACD Analysis

A recent bearish crossover occurred with the MACD line moving below the signal line, although they are converging again, possibly indicating weakening bearish momentum.

The MACD Histogram shows bearish momentum is decreasing, as indicated by the shrinking red bars. This might signal a potential shift towards bullish momentum.

No clear divergences observed between MACD and price action.

Volume Analysis

No significant changes in volume, though there was a noticeable spike during the recent downturn indicating high selling interest.

Recent price recovery is not strongly supported by rising volume, which could imply a lack of strong conviction by buyers.

The large volume spike on the downtrend could indicate institutional activity.

Support & Resistance

Support around 24,750 aligns with recent lows.

Resistance is approximately 25,750, reflecting prior highs where the price struggled to break through.

These levels are critical for future price movements.

Actionable Insights

Buy on confirmation of MACD crossover towards a bullish signal and a break above 25,250 with rising volume.

Sell if the price fails to hold above the 24,750 support level.

Hold if the price remains sideways between 24,750 and 25,750 without strong momentum indicators.

The AI Technical Analysis Center is an informational tool only and does not constitute investment or trading advice.
This site is registered on wpml.org as a development site. Switch to a production site key to remove this banner.