Generic selectors
Exact matches only
Search in title
Search in content
Post Type Selectors

Popular stocks

Crypto

CFD

Currencies

Support

Gold

NZD/USD – Technical Analysis – 4h

February 11, 2026 13:01

Quick Summary

The 4-hour chart of the NZD/USD showcases the recent price movements and technical indicators. The pair has been trading in a somewhat bullish manner, with patterns suggesting potential future shifts.

Observing the support and resistance levels could offer strategic entry and exit points for traders.

Candlestick Analysis

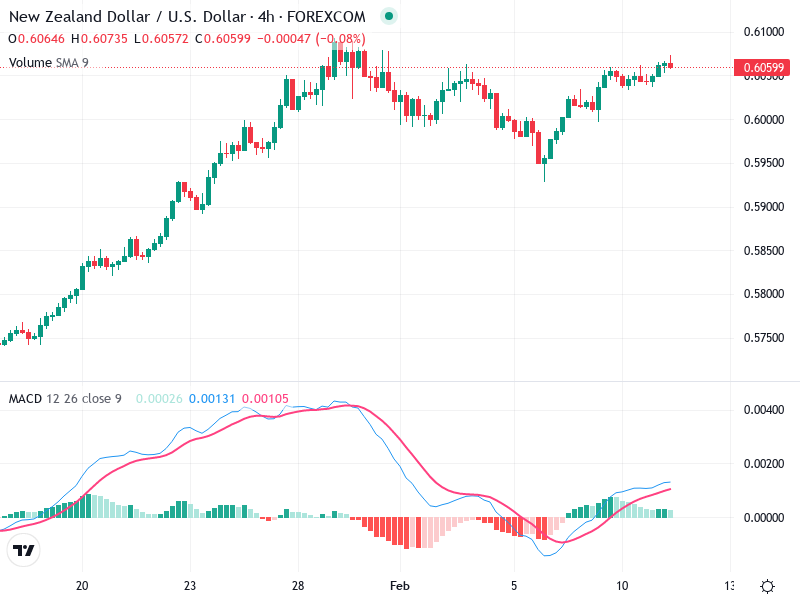
The overall trend is somewhat bullish, marked by a series of higher highs and higher lows from mid-January to early February. However, recent price action shows a sideways consolidation pattern.

A prominent bullish candlestick pattern is missing, but the series of small-bodied candles indicates indecision, suggesting a potential continuation or reversal.

The price activity around 0.6060 to 0.6100 is a critical consolidation area, with breakouts potentially signaling further bullish momentum or a bearish shift below.

MACD Analysis

The MACD line is currently above the Signal line, showing a bullish crossover.

The histogram bars are positive and appear to be increasing, indicating growing bullish momentum.

No clear divergence is noted between MACD and price action, reinforcing the current trends.

Volume Analysis

Trading volume is relatively low, possibly suggesting a lack of strong conviction in the current price movement.

The decrease in volume during sideways movement may imply a potential buildup for a breakout.

No unusual volume spikes are evident, indicating a lack of strong institutional activity.

Support & Resistance

The key support level is around 0.6000, where the price has previously reversed.

The main resistance level is around 0.6100, aligning with recent highs and needing a breakout confirmation for bullish continuation.

Monitoring these levels may provide strategic trading opportunities.

Actionable Insights

Consider entering long positions on a confirmed breakout above 0.6100 with increased volume, supported by MACD bullish signals.

Look to short if the price breaks below the 0.6000 level with increasing volume and a MACD bearish crossover.

Maintain positions within the current range, awaiting a definitive breakout direction.

The AI Technical Analysis Center is an informational tool only and does not constitute investment or trading advice.
This site is registered on wpml.org as a development site. Switch to a production site key to remove this banner.