Generic selectors
Exact matches only
Search in title
Search in content
Post Type Selectors

Popular stocks

Crypto

CFD

Currencies

Support

Gold

AUD/USD – Technical Analysis – 4h

February 11, 2026 13:03

Quick Summary

The AUD/USD chart is currently displaying a bullish trend, characterized by an upward momentum from mid-January to early February. Recent analysis indicates continued optimism in the currency pair’s movement, with key indicators supporting a potential further rise.

Both MACD and volume analysis align with the overall bullish outlook. Traders should note significant support and resistance levels as they strategize.

Candlestick Analysis

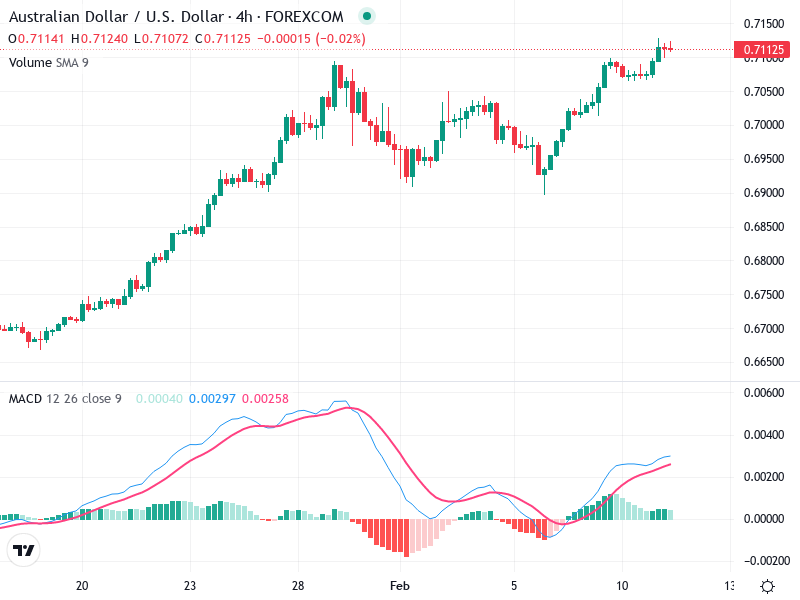
The chart shows a general bullish uptrend from mid-January to early February, with recent consolidation indicating a continuation of the bullish trend.

A Bullish Engulfing Pattern towards the end of January suggests strong buying interest and potential reversal from a short-term downtrend.

Doji Candles around the end of January and early February reflect market indecision, while a breakout above the 0.70500 level signals further bullish momentum.

MACD Analysis

The MACD line being above the Signal line indicates a bullish crossover, suggesting continued upward momentum.

Positive and increasing histogram bars reinforce the bullish momentum, which denotes increasing buying pressure.

No clear divergence is noted between MACD and the price action, reinforcing the current trend.

Volume Analysis

A noticeable increase in volume accompanies the recent price rise around February 5th, supporting the breakout.

Rising volume aligns with the price increase, indicating strong market interest and validation of the current trend.

No unusually high volume spikes suggest significant institutional activity, aside from the noted increases.

Support & Resistance

Key support is established around 0.70000, tested multiple times and holding firm.

The recent peak at approximately 0.71500 could act as a possible resistance, with a break above indicating potential further gains.

Monitoring these levels is crucial for traders aiming to navigate the market effectively.

Actionable Insights

Consider entering long positions on pullbacks near the 0.70500 support area, with stops below 0.70000. A breakout above 0.71500 with volume confirmation could present further buying opportunities.

Traders might think about liquidating positions if the price loses momentum and falls below key support at 0.70000.

Holding long positions could be beneficial as the uptrend remains intact, with the MACD showing bullish signals.

The AI Technical Analysis Center is an informational tool only and does not constitute investment or trading advice.
This site is registered on wpml.org as a development site. Switch to a production site key to remove this banner.