Generic selectors
Exact matches only
Search in title
Search in content
Post Type Selectors

Popular stocks

Crypto

CFD

Currencies

Support

Gold

GBP/USD – Technical Analysis – 4h

February 11, 2026 13:04

Quick Summary

The GBP/USD chart reveals a bullish reversal following a previous downward trend.

Recent market indicators suggest upward momentum as buyers take control.

Candlestick Analysis

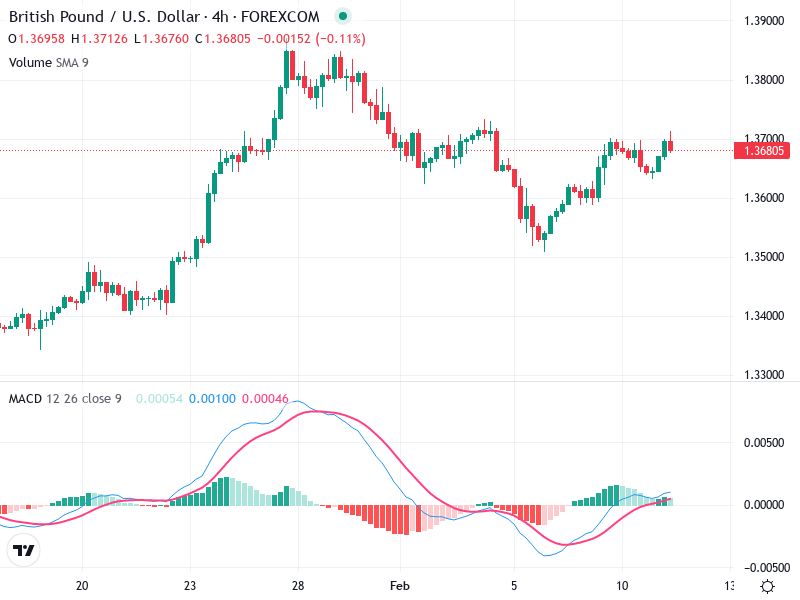
The chart displays an overall bullish reversal after a previous downward trend.

Recent candlesticks suggest a recovery with higher lows and higher highs.

Several doji formations appeared earlier, suggesting indecision, but were later followed by bullish movements.

MACD Analysis

The MACD line has recently crossed above the signal line, indicating a bullish crossover.

The increasing positive bars on the histogram suggest strengthening bullish momentum.

There are no clear divergences between the MACD and price action at the moment.

Volume Analysis

There is an observable increase in volume accompanying the recent price rise, supporting the bullish movement.

A noticeable volume spike coincided with the recent bullish reversal, potentially indicating institutional buying.

Support & Resistance

Key support is around 1.3600, where previous lows were formed.

Immediate resistance is near 1.3700, a critical area for validating further bullish moves.

Actionable Insights

Consider buying if the price sustains above the 1.3700 resistance with continued volume support and MACD bullishness.

Be cautious if the price fails to hold above 1.3700 or if the MACD shows a bearish crossover.

Hold existing long positions unless significant bearish indicators emerge.

The AI Technical Analysis Center is an informational tool only and does not constitute investment or trading advice.
This site is registered on wpml.org as a development site. Switch to a production site key to remove this banner.