Generic selectors
Exact matches only
Search in title
Search in content
Post Type Selectors

Popular stocks

Crypto

CFD

Currencies

Support

Gold

GOLD – Technical Analysis – 4h

February 11, 2026 17:02

Quick Summary

The gold futures chart on the 4-hour timeframe indicates a recovery phase after a significant drop. The asset is currently experiencing a sideways movement with attempts to rally. Overall, the price action suggests a cautious upward trend.

The asset remains in a consolidation phase.

Candlestick Analysis

The chart shows a recovery phase following a sharp decline, moving into a sideways pattern with minor bullish attempts.

A hammer pattern appeared near the bottom of the decline, suggesting a potential reversal that led to an upward trend.

Recent candles show attempts to push higher, albeit without strong momentum.

MACD Analysis

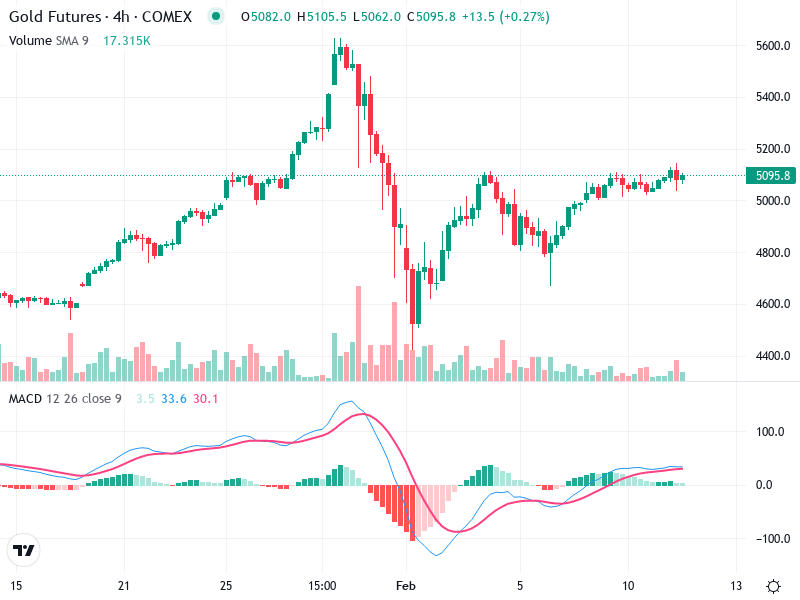
The MACD line is above the Signal line, indicating a bullish stance, though the gap is small, suggesting weak momentum.

The histogram displays positive values, though minimal, which points to reduced bullish momentum. The lack of growth in the histogram signals caution.

No significant divergences between MACD and price action are observed, indicating alignment with the sideways trend.

Volume Analysis

Volume spikes correlated with the previous sharp decline and recovery; however, recent volume trends are on the decline.

The decreasing volume contrasts with the slight upward movement, suggesting a lack of strong conviction behind recent price increases.

The muted volume indicates no significant institutional activity or unusual spikes.

Support & Resistance

Key support is around the 5000 level, where the price stabilized after a significant dip.

Key resistance is noted around the 5100 mark, serving as a cap for recent price consolidation.

The support and resistance levels dictate the current price range.

Actionable Insights

Consider a buy strategy upon a strong breakout above 5100 with increased volume, hinting at potential continuation upward.

A sell approach could be effective if reversal signals appear near resistance, especially with a bearish MACD crossover.

For those holding positions, maintain caution given the sideways pattern and declining volume.

The AI Technical Analysis Center is an informational tool only and does not constitute investment or trading advice.
This site is registered on wpml.org as a development site. Switch to a production site key to remove this banner.