Generic selectors
Exact matches only
Search in title
Search in content
Post Type Selectors

Popular stocks

Crypto

CFD

Currencies

Support

Gold

GOLD – Technical Analysis – 4h

February 12, 2026 17:02

Quick Summary

The current chart analysis of shows a shift in market movement. Key indicators such as candlestick patterns and MACD provide valuable insights into potential future trends.

This analysis highlights the recent transition from bullish to bearish momentum, and the strength observed in volume changes supports these findings.

Candlestick Analysis

The chart shows a recent bearish trend following a strong bullish rally. The price peaked and then experienced a steep decline.

There's a noticeable bearish engulfing pattern near the peak, indicating potential reversal from the recent uptrend. The current candlesticks show downward momentum.

The area around 5000 shows a recent support level that was tested and now appears to be a resistance, following the bearish candles.

MACD Analysis

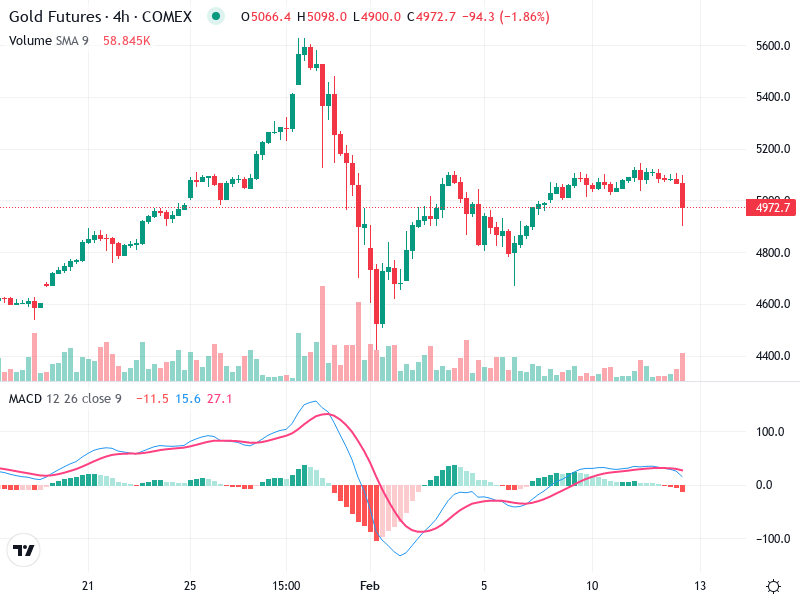
The MACD line has crossed below the Signal line, indicating a recent bearish crossover.

The histogram is negative, indicating that momentum is on the bearish side. There's a decline in momentum as the bars contract, suggesting large bearish moves are lessening but still present.

No clear divergences between the MACD and price action observed at this time.

Volume Analysis

Recent volume spikes align with the bearish price movements, supporting the downward trend. This suggests strong selling pressure.

The volume spike during the large bearish candlestick indicates potential institutional selling, contributing to the downward pressure.

Support & Resistance

No firm support, though the area around 4800 might provide some buying interest based on past price action.

The price near 5000 now acts as resistance following the recent drop.

Actionable Insights

If already holding positions, consider placing strict stop-loss orders below recent support levels.

Selling or reducing positions could be considered at this time due to the bearish crossover in MACD and increasing bearish volume.

Await confirmation of support around 4800 or a bullish reversal pattern for potential reversal trades. Watch for these signals as risk management.

The AI Technical Analysis Center is an informational tool only and does not constitute investment or trading advice.
This site is registered on wpml.org as a development site. Switch to a production site key to remove this banner.