Generic selectors
Exact matches only
Search in title
Search in content
Post Type Selectors

Popular stocks

Crypto

CFD

Currencies

Support

Gold

NSDQ – Technical Analysis – 4h

February 13, 2026 08:01

Quick Summary

The NASDAQ 100 Index chart is currently exhibiting a bearish trend with significant downward pressure.

The price action shows lower highs and lower lows, indicating persistent negative momentum.

This analysis provides insights into potential trading strategies and key levels to monitor.

Candlestick Analysis

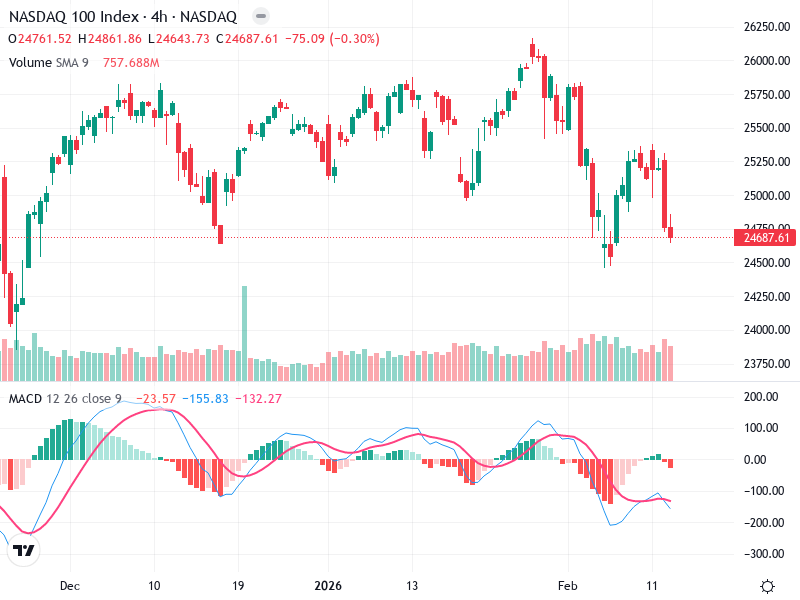
The overall trend in the chart appears bearish in the short term, with a series of lower highs and lower lows.

There are multiple instances of bearish engulfing patterns that signify further bearish sentiment. Recent candlesticks indicate a strong downward pressure.

The price appears to have recently broken below a key support level around 25,000, suggesting increased bearish momentum.

MACD Analysis

The MACD line is below the Signal line, indicating a bearish crossover. This crossover suggests ongoing negative momentum.

The histogram is in negative territory and is showing little sign of converging towards zero, indicating persistent bearish momentum.

No clear divergence is visible between price action and the MACD, reinforcing the bearish trend.

Volume Analysis

There is a spike in selling volume that coincides with the recent price drop, confirming the bearish breakout.

The increased volume on down days supports the bearish price action, suggesting solid participation by sellers.

The volume does not show any unusually significant institutional activity beyond the increased selling pressure.

Support & Resistance

The next significant resistance zone is around the 25,500 level, where the price has previously faced rejection.

Immediate support is expected around the 24,500 level, this could serve as a potential bounce area if the bearish momentum weakens.

Actionable Insights

Given the current bearish trend, short positions could be considered on any bullish retracements.

If the price confirms a close below the 24,500 support with strong volume, further downside may be anticipated.

Monitor for bullish reversal patterns or a MACD bullish crossover before considering long positions for potential reversals.

The AI Technical Analysis Center is an informational tool only and does not constitute investment or trading advice.
This site is registered on wpml.org as a development site. Switch to a production site key to remove this banner.