Generic selectors
Exact matches only
Search in title
Search in content
Post Type Selectors

Popular stocks

Crypto

CFD

Currencies

Support

Gold

EUR/USD – Technical Analysis – 4h

February 13, 2026 08:03

Quick Summary

The EUR/USD chart currently displays a phase of consolidation following a previous uptrend. Price action suggests indecision in the market as traders await strong signals to define the next move. Key levels to watch are crucial for predicting future trends.

Candlestick Analysis

The EUR/USD 4-hour chart shows an overall sideways trend after a previous uptrend. The recent price action suggests consolidation.

There are no significant candlestick patterns like bullish engulfing or hammers visible recently. The presence of multiple small-bodied candles indicates indecision in the market.

Resistance appears around the 1.1950 level which was tested multiple times but not conclusively broken. The support zone is approximately at 1.1800.

MACD Analysis

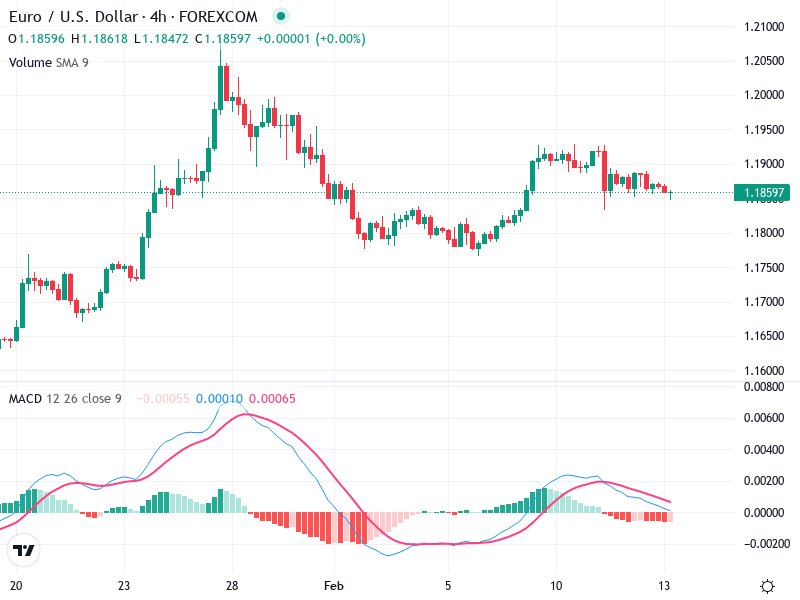
The MACD line is converging with the Signal line from above, which may indicate a pending bearish crossover. This suggests weakening momentum on the bullish side.

The histogram bars are shrinking towards zero, indicative of decreasing bullish momentum and indecision probably moving towards a more bearish outlook.

No clear divergences observed between price action and MACD.

Volume Analysis

Volume is relatively stable, with no significant spikes. This supports the sideways price action and lack of momentum in either direction.

No unusual volume activity suggests a lack of strong institutional involvement at present.

The current volume trend aligns with the market's indecisiveness.

Support & Resistance

Key resistance is identified near 1.1950. A breakout above this level with volume confirmation could indicate a continuation of the prior uptrend.

Significant support is seen around 1.1800. A breakdown below this level could trigger further declines.

These levels are pivotal for determining potential future movements.

Actionable Insights

Monitor for a decisive move above 1.1950 or below 1.1800 to define the next directional bias. Currently, a sideways trading strategy could be employed with cautious stops.

Await confirmation through a candlestick pattern or a MACD signal to act on a trend reversal or continuation.

Monitoring macroeconomic data could provide additional clues for anticipating significant chart movements.

The AI Technical Analysis Center is an informational tool only and does not constitute investment or trading advice.
This site is registered on wpml.org as a development site. Switch to a production site key to remove this banner.