Generic selectors
Exact matches only
Search in title
Search in content
Post Type Selectors

Popular stocks

Crypto

CFD

Currencies

Support

Gold

NZD/USD – Technical Analysis – 4h

February 13, 2026 13:01

Quick Summary

The chart currently illustrates a consolidation phase near key levels. The lack of significant bullish patterns suggests caution. This situation, alongside certain resistance points, highlights potential trend shifts.

Attention should be paid to bearish indicators that could lead to further downside risks.

Candlestick Analysis

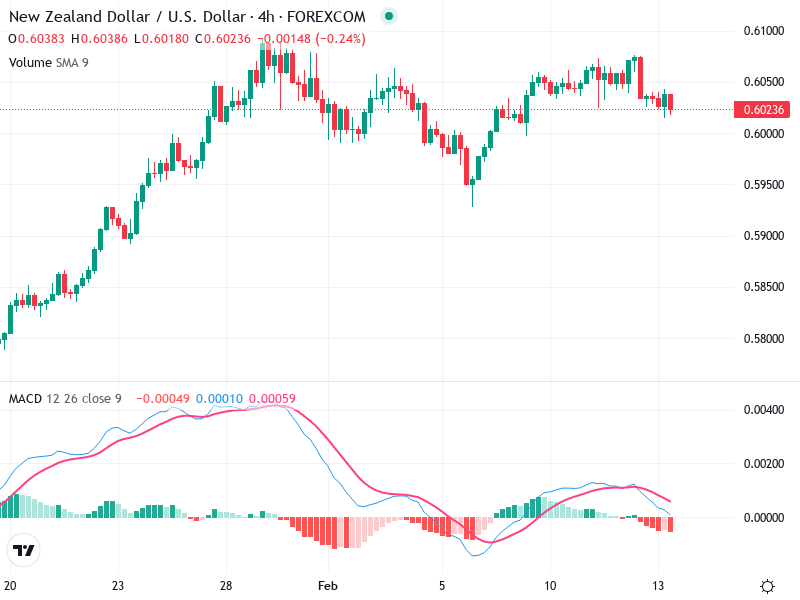
Currently, no major candlestick patterns such as a bullish engulfing or hammer are visible. However, there is some consolidation near the 0.60236 level, suggesting an area of indecision.

The trend has recently been sideways with hints of a bearish bias as the price struggles to surpass previous highs, showing resistance around the 0.60500 level.

Price has pulled back from recent highs near 0.60500 and is testing the 0.60200 area as support. A breakout below this level could indicate further downside pressure.

MACD Analysis

The MACD line is slightly below the Signal line, indicating bearish momentum. A recent bearish crossover is noted, hinting at a potential decrease in price.

The histogram is negative and expanding, further confirming the current bearish momentum and suggesting potential downside.

No significant divergence is currently observed between MACD and price action, supporting the bearish sentiment.

Volume Analysis

Volume remains stable with no notable spikes, indicating a lack of strong buying or selling pressure.

The recent decline in price isn't accompanied by high volume, suggesting it may lack conviction or be a consolidation phase.

No unusual volume spikes suggesting institutional activity at this time.

Support & Resistance

Primary support is around 0.60000, considered a psychological and technical barrier. A break below could lead to enhanced selling pressure.

Immediate resistance is at 0.60500, which has prevented price breaks recently. Strong momentum is necessary to surpass this level.

No further drastic support or resistance levels identified.

Actionable Insights

Consider a sell strategy if support at 0.60000 breaks, implementing tight stop-losses above nearby resistance.

If holding a position, watch for support confirmation at current levels for a potential bounce.

Consider buying on a confirmed break above 0.60500 with strong volume for potential gains.

The AI Technical Analysis Center is an informational tool only and does not constitute investment or trading advice.
This site is registered on wpml.org as a development site. Switch to a production site key to remove this banner.