Generic selectors
Exact matches only
Search in title
Search in content
Post Type Selectors

Popular stocks

Crypto

CFD

Currencies

Support

Gold

AUD/USD – Technical Analysis – 4h

February 13, 2026 13:02

Quick Summary

The chart displays a strong uptrend initially, reaching a notable peak before a bearish correction emerges.

The asset’s price movement indicates a potential shift, highlighting both buyer and seller positions as it retests key levels.

Candlestick Analysis

There appears to be a bearish engulfing pattern followed by a downtrend on the right side of the chart, indicating potential selling pressure.

A series of smaller-bodied candles can be seen near the top, suggesting indecision before the downtrend initiated.

The chart shows a bullish trend that peaks and transitions into a bearish correction.

MACD Analysis

The MACD line has crossed below the signal line, indicating a bearish crossover, which suggests increasing bearish momentum.

The histogram is in negative territory and expanding, signaling strengthening downward momentum.

There are no notable divergences between the MACD and price action observed currently.

Volume Analysis

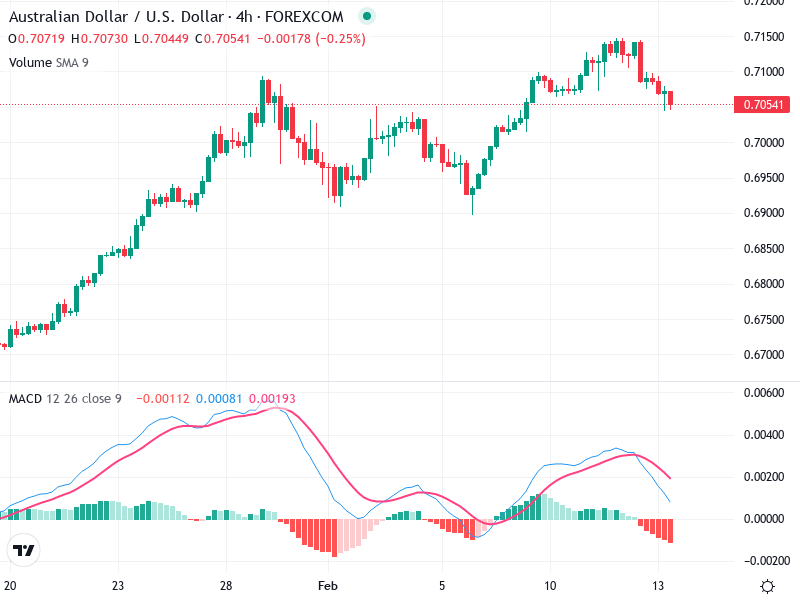
Volume appears to increase during the initial uptrend, supporting the price movement. Lately, volume seems to be decreasing, coinciding with the bearish correction.

The support for the initial uptrend by rising volume indicates a healthy bullish trend. The subsequent pullback on diminishing volume suggests the lack of strong selling pressure currently.

No significant unusual spikes in volume noted that would indicate institutional activity in the recent candles.

Support & Resistance

A key support level is around 0.7050, where the price is currently hovering. A break below this could indicate further bearish momentum.

Resistance is likely around the 0.7150 level, the recent peak before the downturn.

Actionable Insights

Hold: If currently long due to bearish momentum and a pending test of support.

Sell: Consider selling if the price closes below the 0.7050 support with increased volume.

Watch for confirmation of a break below 0.7050 for continued downside or reversal signals such as bullish reversal patterns.

The AI Technical Analysis Center is an informational tool only and does not constitute investment or trading advice.
This site is registered on wpml.org as a development site. Switch to a production site key to remove this banner.