Generic selectors
Exact matches only
Search in title
Search in content
Post Type Selectors

Popular stocks

Crypto

CFD

Currencies

Support

Gold

GBP/USD – Technical Analysis – 4h

February 16, 2026 13:04

Quick Summary

The chart for reveals important insights into the current market dynamics. Initially, a strong bearish movement led to a sideways trend. This indicates a period of consolidation between significant support and resistance levels.

Given the current situation, the analysis of various indicators suggests potential future price movements which investors should consider.

Candlestick Analysis

The chart shows a sideways trend following a bearish movement. The price initially declined sharply, and then began to consolidate between 1.3550 and 1.3700.

A sharp downward move indicates strong selling pressure followed by a series of indecisive candles.

Recent candles show smaller bodies and alternating colors, indicating indecision and a lack of strong directional movement.

MACD Analysis

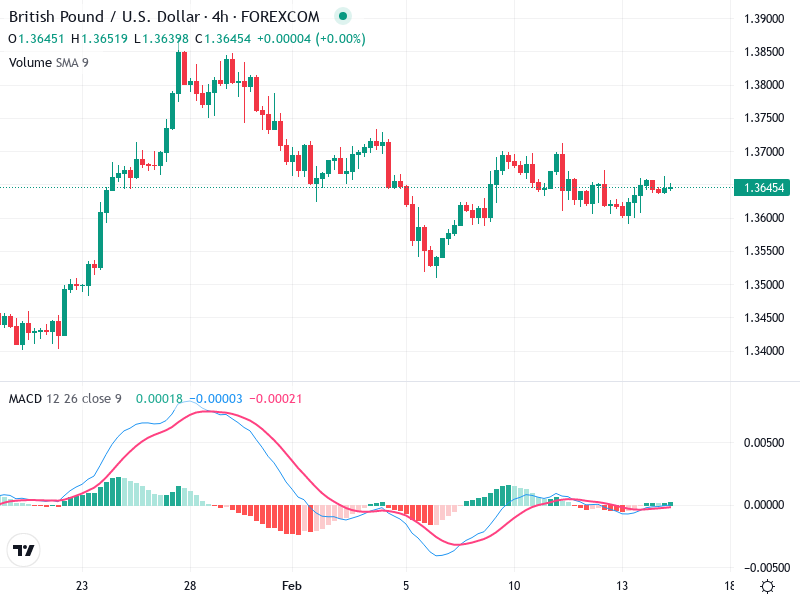
The MACD line is close to crossing the Signal line, suggesting potential upcoming price momentum. However, the current positioning remains flat, implying uncertainty.

The histogram bars are near zero, reflecting weak momentum in the current market. There is no clear bullish or bearish divergence observable on the chart.

No significant divergences detected as the MACD is relatively flat, mirroring price consolidation.

Volume Analysis

Volume has decreased following the sharp price movement, coinciding with the sideways trend, suggesting reduced trading interest or consolidation.

No prominent spikes, suggesting an absence of strong institutional activity in either direction currently.

Support & Resistance

Support is near 1.3550, which has held recently after the bearish move.

Resistance is seen at around 1.3700, where price action has previously reversed, forming a resistance barrier.

Actionable Insights

Consider entering on a confirmed breakout above 1.3700 with strong volume support for a potential trend reversal.

A break below 1.3550 could indicate continuation of bearish momentum.

Given the sideways trend, holding is advisable until a strong move dictates direction.

The AI Technical Analysis Center is an informational tool only and does not constitute investment or trading advice.
This site is registered on wpml.org as a development site. Switch to a production site key to remove this banner.