Generic selectors
Exact matches only
Search in title
Search in content
Post Type Selectors

Popular stocks

Crypto

CFD

Currencies

Support

Gold

EUR/USD – Technical Analysis – 4h

February 17, 2026 08:03

Quick Summary

The EUR/USD 4-hour chart reveals fluctuating market conditions with recent candlestick patterns indicating indecision.

Despite intermittent bullish rallies, the overall market trend displays a bearish inclination with key support and resistance levels.

Candlestick Analysis

The chart shows a recent bullish reversal pattern around the end of January, followed by a bearish trend into February.

There's intermittent presence of doji candlesticks indicating market indecision, particularly in the latest sessions.

The trend over the last few weeks is bearish with lower highs and lower lows forming. The current movement appears sideways to slightly bearish.

MACD Analysis

There is a recent bearish crossover with the MACD line crossing below the signal line, suggesting possible short-term downward momentum.

The MACD histogram is showing slight negative momentum, aligning with the bearish sentiment.

No clear divergences are observable. Current MACD movement aligns with the price direction.

Volume Analysis

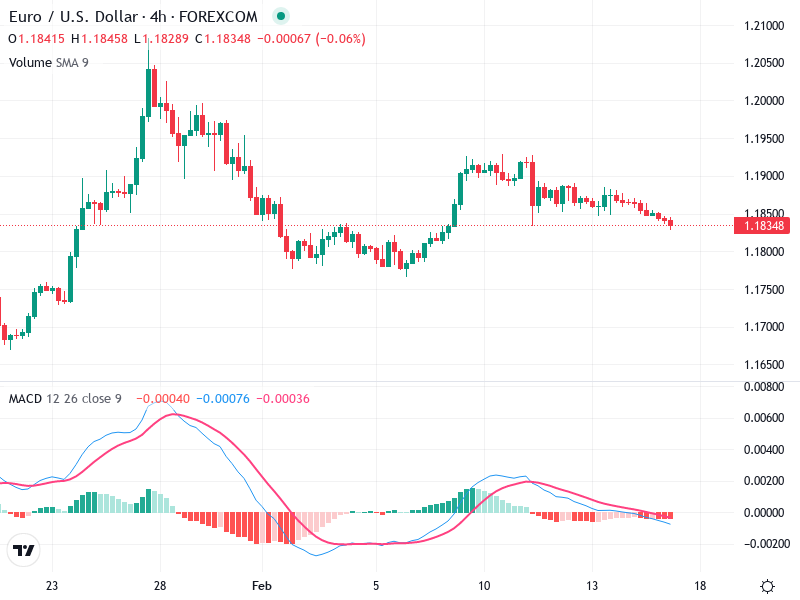
There are periodic spikes in volume, especially around the end of January, correlating with a bullish rally.

Currently, volume levels seem average, supporting the current sideways movement.

The strength of recent bearish movements is somewhat muted, given the average volume, suggesting consolidation rather than a sharp decline.

Support & Resistance

Key support is observed around 1.180, which has been tested multiple times.

Resistance is likely around 1.195, reflecting the top end of the latest trading range.

Breaking below support or above resistance could indicate the next directional move.

Actionable Insights

Consider buying if the price strongly bounces off the 1.180 support level with confirmation of increased volume.

Selling opportunities might arise if the price breaks below the 1.180 support, confirmed by MACD bearish momentum.

Given the sideways movement, a hold strategy may be suitable until a clear breakout is observed.

The AI Technical Analysis Center is an informational tool only and does not constitute investment or trading advice.
This site is registered on wpml.org as a development site. Switch to a production site key to remove this banner.