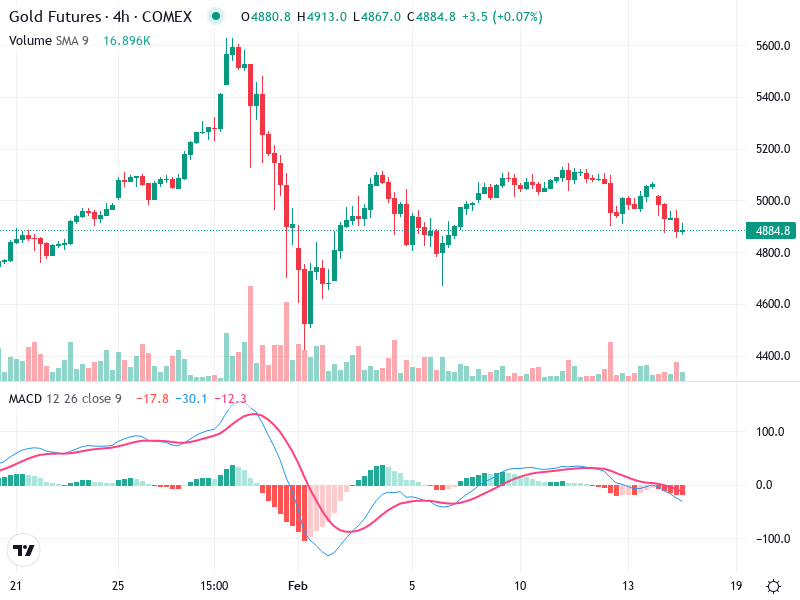
The chart depicts significant market activities with essential levels of support and resistance. has seen a period of consolidation with potential breakout opportunities. The MACD and volume analysis provide insights into market momentum and trading interest.
Candlestick Analysis
The chart shows a predominantly sideways trend with some volatility.
Several red (bearish) and green (bullish) candles reflect the choppy market conditions.
No clear patterns like bullish engulfing or hammer are visible that signify strong reversals.
MACD Analysis
The MACD line has crossed below the Signal line indicating bearish momentum.
The histogram is slightly negative, supporting a bearish sentiment.
No clear divergences between MACD and price action are evident at this moment.
Volume Analysis
Volume spikes are observed during large bearish and bullish moves suggesting institutional activity.
Current trading volumes are lower compared to the previous spikes.
The volume does not strongly support the latest price moves.
Support & Resistance
Strong support exists around the 4800 level.
Resistance is observed around the 5000 level, with repeated failures to break through.
The 4900 level is a potential breakout zone if the price breaks above consistently.
Actionable Insights
Consider buying near the 4800 support level if confirmed by bullish patterns.
Selling near the 5000 resistance level could be considered until a breakout is confirmed.
Current consolidation suggests a hold strategy unless a significant breakout or breakdown is confirmed.
The AI Technical Analysis Center is an informational tool only and does not constitute investment or trading advice.