Generic selectors
Exact matches only
Search in title
Search in content
Post Type Selectors

Popular stocks

Crypto

CFD

Currencies

Support

Gold

GBP/USD – Technical Analysis – 4h

February 18, 2026 13:04

Quick Summary

The GBP/USD 4-hour chart reflects significant technical indicators suggesting potential market movements. The asset shows varied signals across different analysis tools, offering insights into its current state.

Key levels and momentum indicators are crucial for understanding the potential directional shift of this currency pair.

Candlestick Analysis

Recent candlestick patterns indicate a potential bullish reversal, as shown by a long wick on a green candle, suggesting buying pressure near the low.

The overall trend is currently bearish with lower highs and lower lows observed over recent periods.

The price recently bounced off the 1.3550 support zone. A breakout above 1.3600 could signal a short-term bullish reversal.

MACD Analysis

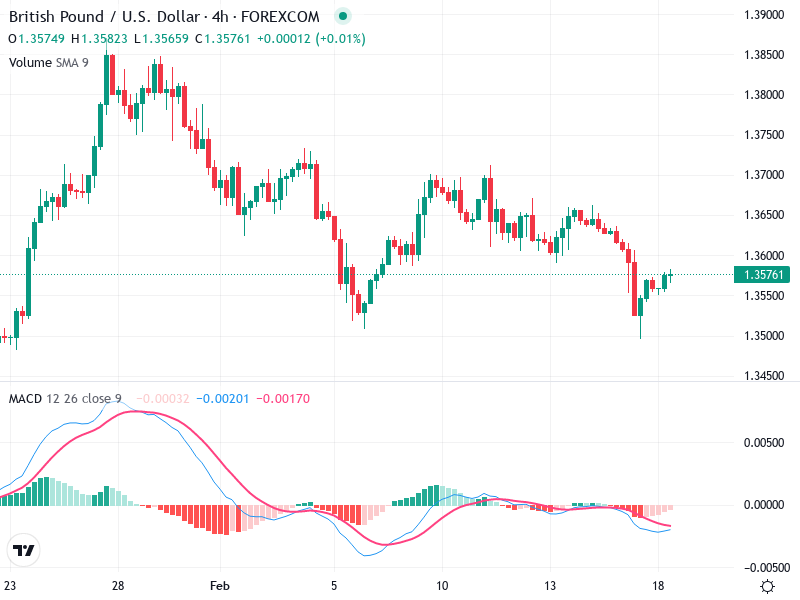
A recent bearish crossover was observed where the MACD line crossed below the signal line, indicating bearish momentum, though convergence is occurring.

The MACD histogram reveals decreasing negative bars, suggesting weakening bearish momentum and possible bullish crossover.

No significant divergence is observed between the MACD and price action, meaning the indicators align with current price movements.

Volume Analysis

Volume levels remain stable, with no major spikes, indicating a steady trading environment.

The lack of high volume in the downtrend suggests weak bearish commitment, hinting at a possible reversal.

No unusual volume spikes, indicating no sign of strong institutional activity.

Support & Resistance

The key support level is around 1.3550, historically acting as a bounce point.

Resistance is noted around 1.3650, where previous rally attempts have failed.

These levels are critical for identifying potential reversals or breakouts, especially with current price actions.

Actionable Insights

If the price closes above 1.3600 with increased buying volume, a buying opportunity could emerge, aiming for a target around 1.3650.

A break below 1.3550 with high volume may indicate increased selling pressure.

Monitoring for confirmation of momentum shift through MACD crossover and volume increase will be vital for executing trades effectively.

The AI Technical Analysis Center is an informational tool only and does not constitute investment or trading advice.
This site is registered on wpml.org as a development site. Switch to a production site key to remove this banner.