Generic selectors
Exact matches only
Search in title
Search in content
Post Type Selectors

Popular stocks

Crypto

CFD

Currencies

Support

Gold

GOLD – Technical Analysis – 4h

February 18, 2026 17:02

Quick Summary

The gold futures chart shows mixed signals with periodic bullish rallies followed by bearish corrections, creating a sideways market trend.

Key resistance and support levels are tested, with the asset reflecting cautious optimism in market sentiment.

Candlestick Analysis

The overall trend appears to fluctuate, with periods of bullish rallies followed by bearish corrections, indicating a sideways market with no strong directional bias currently.

Instances of bullish engulfing patterns around February suggest potential bullish commitment after downtrends.

Doji candles near price consolidations indicate indecision, typically followed by a potential reversal or continuation.

MACD Analysis

The MACD line is crossing above the Signal line at the most recent point, suggesting a bullish crossover.

The histogram is showing increasing positive bars, indicating growing bullish momentum.

There's a visible bullish divergence where price made a lower low while the MACD made a higher low, suggesting potential upward movement.

Volume Analysis

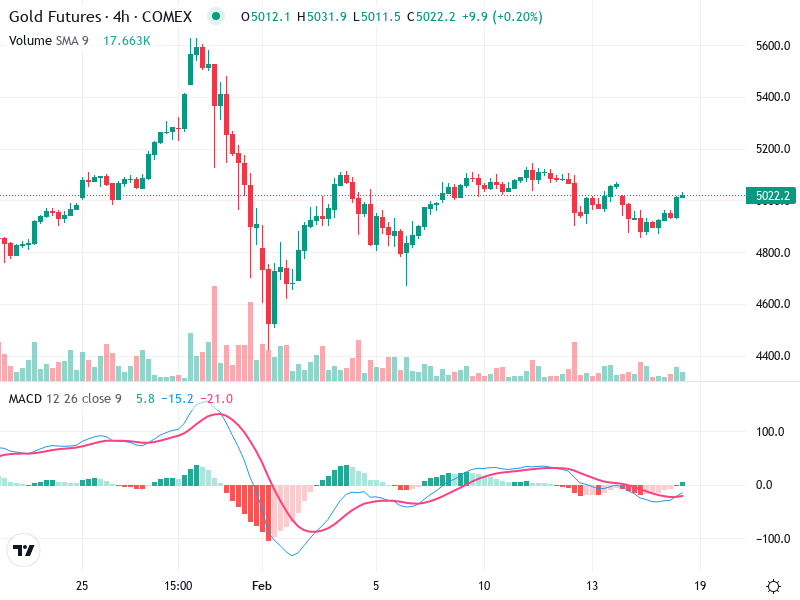
Volume spikes correspond with market moves, showing increased trader interest, especially around end of January and early February.

The decrease in volume recently suggests a potential weakening in momentum of the latest move, urging caution for trend continuation.

Large volume bars during downtrends could suggest institutional involvement, possibly for accumulation.

Support & Resistance

Key support near the 4800 level where price bounced multiple times, serving as strong support.

Key resistance around 5200, where price struggled to sustain despite touching or breaking briefly.

Price attempted a breakout above the 5020 level, which could turn significant if sustainably broken.

Actionable Insights

Consider accumulating on dips near the 4800 support level, watching the volume for confirmation.

Be cautious near the 5200 resistance; use tight stops or consider taking profits unless a strong breakout is confirmed.

Ideal to hold if price sustains above 5020 with supportive volume.

The AI Technical Analysis Center is an informational tool only and does not constitute investment or trading advice.
This site is registered on wpml.org as a development site. Switch to a production site key to remove this banner.