Generic selectors
Exact matches only
Search in title
Search in content
Post Type Selectors

Popular stocks

Crypto

CFD

Currencies

Support

Gold

AUD/USD – Technical Analysis – 4h

February 19, 2026 13:02

Quick Summary

The AUD/USD 4-hour chart reveals potential price movements for traders. The asset shows technical indicators that provide insight into possible future trends. Observing key levels and volume can guide trading strategies.

Candlestick Analysis

Recent candlesticks show doji-like patterns indicating indecision in the market.

A series of lower highs and higher lows suggest a consolidation phase.

The trend is currently sideways with mild bearish pressure.

MACD Analysis

The MACD line is slightly below the signal line, indicating a weak bearish momentum.

The histogram is showing short red bars, suggesting low momentum and a possible convergence.

No significant divergences observed between MACD and price action.

Volume Analysis

The volume is consistent with the sideways movement, suggesting lack of strong bullish or bearish sentiment.

Low volume supports the current consolidation phase.

No significant volume spikes indicating institutional activity.

Support & Resistance

Around 0.7000, a psychological level that has been tested multiple times.

Near 0.7060, a level that needs to be breached for further bullish movement.

These levels are critical for detecting potential breakouts or reversals.

Actionable Insights

Consider a wait-and-see approach until a clear breakout or breakdown confirms direction.

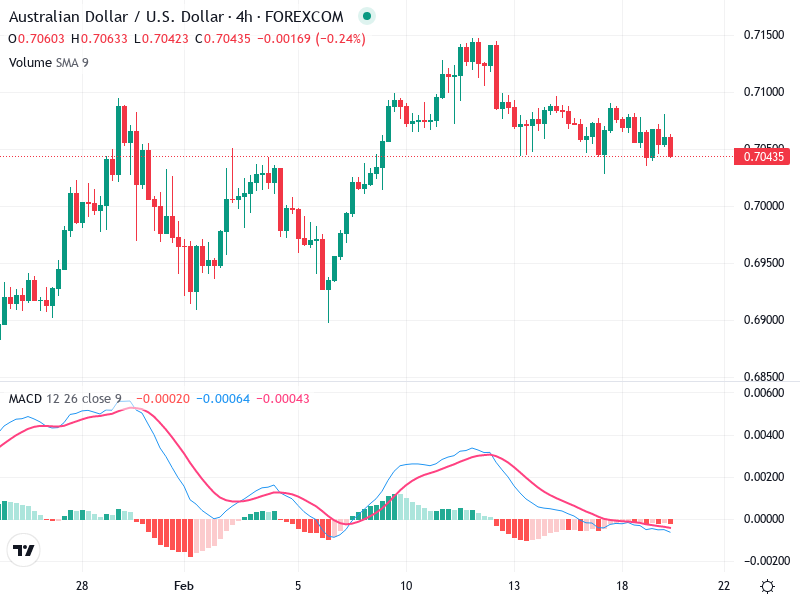
Possible buy strategy above 0.7060 with a confirmed breakout, or a sell strategy below 0.7000 upon strong bearish confirmation.

Fake breakouts due to low volume, so confirmation with volume is essential.

The AI Technical Analysis Center is an informational tool only and does not constitute investment or trading advice.
This site is registered on wpml.org as a development site. Switch to a production site key to remove this banner.