Generic selectors
Exact matches only
Search in title
Search in content
Post Type Selectors

Popular stocks

Crypto

CFD

Currencies

Support

Gold

GOLD – Technical Analysis – 4h

February 19, 2026 17:02

Quick Summary

The gold Futures chart displays periods of indecision with Doji-like candles, indicating potential reversals or consolidation. The overall trend is sideways following a volatile period, with recent candles showing a tight trading range. Key resistance is observed around 5040, while support is near 4900, signaling this as the range for potential breakouts.

Candlestick Analysis

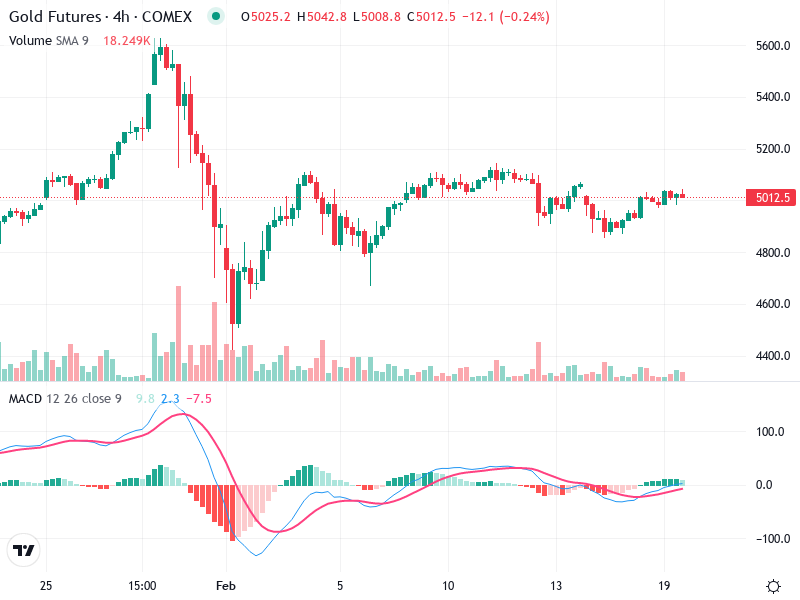
The chart shows periods of indecision with Doji-like candles around the recent price levels, indicating potential reversals or consolidation.

The trend appears sideways following a volatile period, with recent candles showing a tight trading range.

Resistance appears around 5040, while there is support near the 4900 level, signaling this as the range for potential breakouts.

MACD Analysis

There is a convergence between the MACD line and the Signal line, indicating limited momentum currently, though previously there was a bullish crossover.

The histogram is close to zero, showing reduced momentum but slight bullish tendencies.

No notable divergence is observed, as price action and MACD movements are aligned.

Volume Analysis

Volume sees spikes during price drops and rallies, indicating strong interest or profit-taking.

The volume decrease alongside the sideways movement suggests a lack of strong trading conviction.

Past spikes around price declines suggest potential positions being closed or initiated by larger players.

Support & Resistance

5040 is a key resistance that, if broken, could suggest a stronger bullish move.

4900 stands as a support level, critical for maintaining the current price range.

Breaching these levels could lead to stronger directional moves either upwards or downwards.

Actionable Insights

Considering the sideways movement, traders might consider a range-bound strategy by buying near support and selling near resistance.

Look for a breakout above 5040 or below 4900 with strong volume as a confirmation signal for trend continuation or reversal.

Lack of momentum may lead to sudden breakouts without much warning, so maintaining close stop-losses is advisable.

The AI Technical Analysis Center is an informational tool only and does not constitute investment or trading advice.
This site is registered on wpml.org as a development site. Switch to a production site key to remove this banner.