Generic selectors
Exact matches only
Search in title
Search in content
Post Type Selectors

Popular stocks

Crypto

CFD

Currencies

Support

Gold

EUR/USD – Technical Analysis – 4h

February 20, 2026 08:03

Quick Summary

The EUR/USD 4-hour chart shows a strong bearish trend with clear signals pointing towards further downside potential.

Key resistance is observed at 1.1900 with support levels around 1.1730.

This analysis suggests a cautious approach, considering the current market trends.

Candlestick Analysis

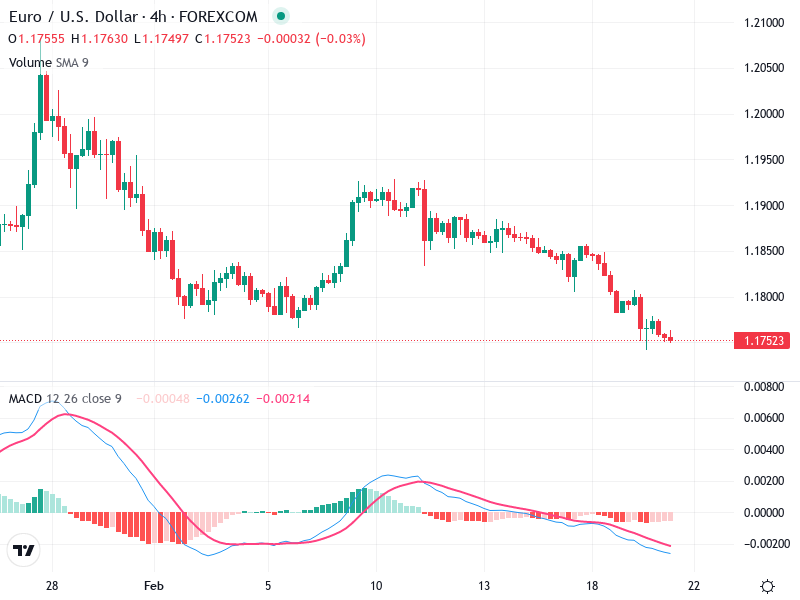
The overall trend observed in the chart is bearish, confirmed by a series of lower highs and lower lows.

Several bearish candlestick patterns have formed, particularly around the break below 1.1900, reinforcing the downward trend.

There's a notable break below 1.1900, with pullbacks acting as resistance, indicating strong bearish momentum.

MACD Analysis

The MACD line is below the Signal line, indicating a bearish crossover and suggesting continued bearish momentum.

The MACD histogram shows increasing negative values, reinforcing the downside momentum.

There are no significant divergences between price action and the MACD, corroborating the bearish trend.

Volume Analysis

Volume remains relatively stable with occasional spikes that coincide with bearish moves, confirming bearish sentiment.

The absence of significant volume spikes implies lacking strong institutional activity, indicating less conviction in moves.

This stable volume pattern supports the ongoing bearish market trend.

Support & Resistance

Key support is observed around the 1.1730 level, a previous area of buying interest.

The 1.1900 zone acts as substantial resistance due to previous highs and resistive pullbacks post-breakout.

These levels are crucial in determining potential market movements and trend strength.

Actionable Insights

Consider selling on rallies towards resistance levels or breakdowns below support for short positions.

Place a stop-loss slightly above the 1.1900 resistance to minimize risk.

Initial targets should be near 1.1730, with further considerations if the trend continues.

The AI Technical Analysis Center is an informational tool only and does not constitute investment or trading advice.
This site is registered on wpml.org as a development site. Switch to a production site key to remove this banner.