Generic selectors
Exact matches only
Search in title
Search in content
Post Type Selectors

Popular stocks

Crypto

CFD

Currencies

Support

Gold

OIL – Technical Analysis – 4h

February 20, 2026 17:00

Quick Summary

The Crude Oil Futures chart is currently exhibiting significant movements and trends.

Recent changes indicate potential opportunities for traders.

It’s crucial to study the various elements for actionable insights.

Candlestick Analysis

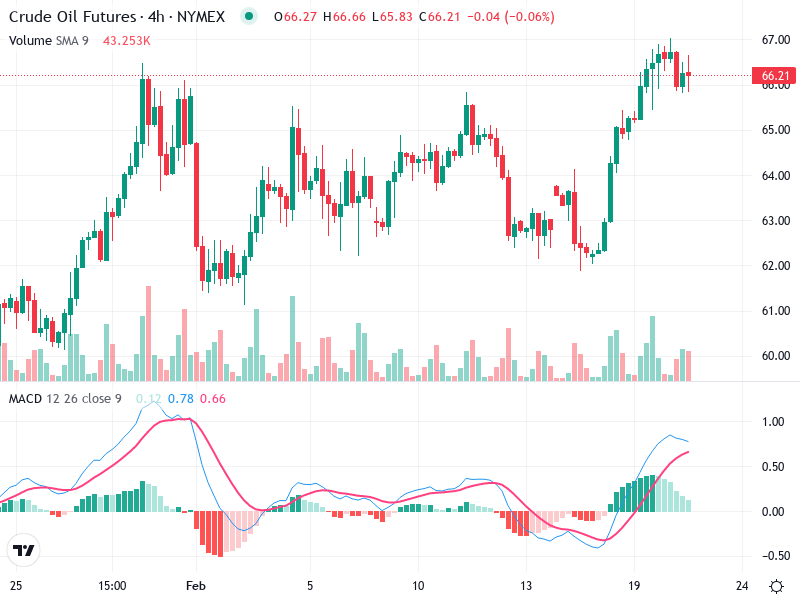
Recent bullish momentum is evidenced by large green candlesticks, indicating strong buying pressure.

A minor pullback is currently evident with small red candlesticks, suggesting a pause in the upward momentum.

The chart shows an upward trend from the beginning of February, with prices making higher highs and higher lows.

MACD Analysis

The MACD (blue line) is currently above the Signal line (red line), but they are converging, indicating potential weakening of bullish momentum.

Positive histogram bars are declining, supporting the observation of weakening bullish momentum.

No clear divergence is evident between MACD and price action.

Volume Analysis

Volume spiked during the breakout, confirming strong bullish interest.

Recent volume decrease aligns with the current price consolidation.

Volume patterns support the recent bullish breakout; however, the current decrease in volume could indicate indecision or a lack of strong momentum in the pullback phase.

Support & Resistance

Around the $64.00 level, where the previous breakout occurred.

The most recent highs around $67.00 could act as resistance if prices attempt to move higher again.

Monitoring these levels is essential for future price movement predictions.

Actionable Insights

Consider buying on a pullback to the $64.00 support level with proper confirmation of a bounce.

Look for selling opportunities if the price fails to sustain above the $67.00 resistance or if the MACD confirms a bearish crossover.

Maintain positions while monitoring for clear breakout signals above $67.00 or breakdowns below $64.00.

The AI Technical Analysis Center is an informational tool only and does not constitute investment or trading advice.
This site is registered on wpml.org as a development site. Switch to a production site key to remove this banner.