Generic selectors
Exact matches only
Search in title
Search in content
Post Type Selectors

Popular stocks

Crypto

CFD

Currencies

Support

Gold

GOLD – Technical Analysis – 4h

February 20, 2026 17:02

Quick Summary

The gold Futures chart is showing a potential buildup phase.

Traders should watch for breakout signals supported by volume.

Monitoring MACD and confirming with volume will be key for decision making.

Candlestick Analysis

There is a formation of several doji candles, suggesting indecision in the market around the current price levels.

This could indicate a potential reversal or continuation of the current trend once a clearer direction is established.

The overall trend appears sideways after a prior downtrend, as the price consolidates around the 5050 to 5100 range.

MACD Analysis

The MACD line is above the Signal line, indicating a current bullish crossover.

This suggests a potential for upward momentum.

No significant divergences noted between MACD and price action at this level; the MACD movement aligns with the price consolidation.

Volume Analysis

Volume appears muted with no significant surges, supporting the sideways trend.

Lack of strong sentiment in either direction is apparent.

No unusual spikes, suggesting limited institutional activity or major market-moving news.

Support & Resistance

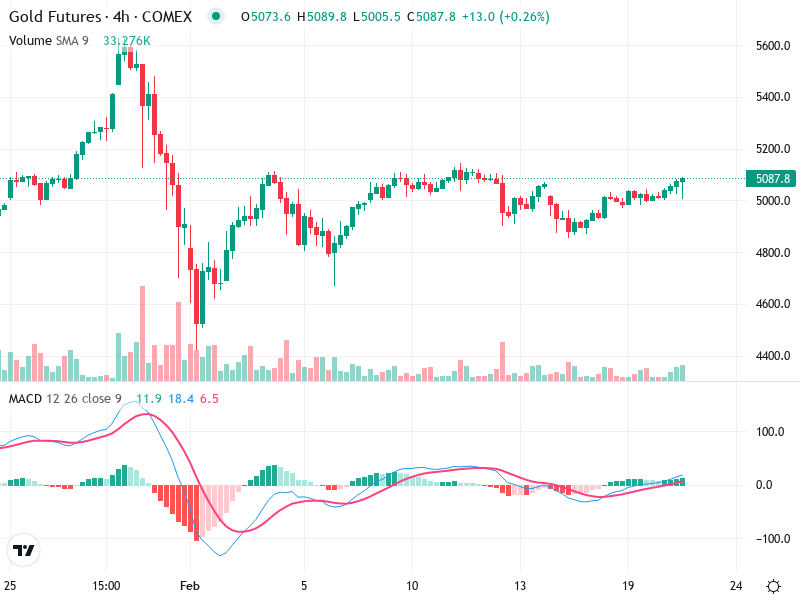
The immediate resistance level is around 5100, which needs to be convincingly broken for a bullish trend continuation.

Key support is near the 4900 level, which has historically held during recent pullbacks.

Potential breakout zone around 5100, where a strong move could indicate the next trend direction.

Actionable Insights

Consider buying if there’s a breakout above the 5100 resistance level with increased volume for confirmation.

A sell or short position could be considered if prices break below the 4900 level, confirming a potential downtrend continuation.

Holding may be prudent given the current sideways movement, unless clear confirmation of trend direction is observed.

The AI Technical Analysis Center is an informational tool only and does not constitute investment or trading advice.
This site is registered on wpml.org as a development site. Switch to a production site key to remove this banner.