Generic selectors
Exact matches only
Search in title
Search in content
Post Type Selectors

Popular stocks

Crypto

CFD

Currencies

Support

Gold

AUD/USD – Technical Analysis – 4h

February 23, 2026 13:02

Quick Summary

The analysis of the Asset chart reveals a predominant sideways movement, indicating consolidation. This behavior suggests that traders may be awaiting further data or events to initiate a more definitive price movement.

The key areas of interest are positioned at the 0.705 support level and the 0.710 resistance level, both serving as potential triggers for future direction.

Candlestick Analysis

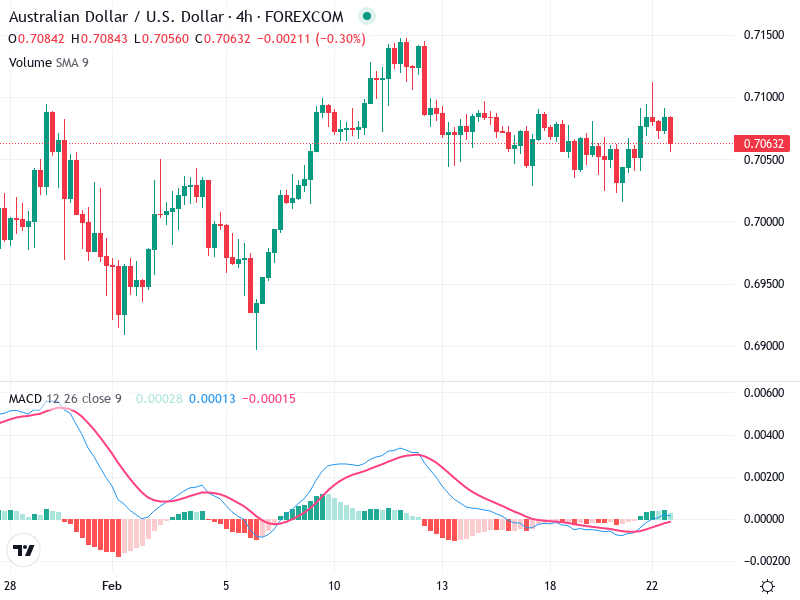
The chart shows a sideways trend with some fluctuations. Recently, the price seems to oscillate between 0.705 and 0.710.

There is no clear prominent candlestick pattern at a glance. However, the small-bodied candles indicate a period of indecision or consolidation.

A potential breakout zone exists around 0.710. If the price closes above this level with strong bullish candlesticks, it could confirm a breakout.

MACD Analysis

The MACD line is slightly above the Signal line, indicating a minor bullish crossover. This suggests a slight bullish sentiment.

The histogram is in positive territory but showing very small bars, reflecting weak bullish momentum.

No clear divergence between MACD and price action, indicating that current price movements are supported by MACD action.

Volume Analysis

The volume appears steady without noticeable spikes, suggesting a lack of strong buying or selling pressure.

Current volume levels support the sideways price movements and lack of significant breakout or breakdown.

The lack of significant volume spikes suggests minimal institutional involvement at the moment.

Support & Resistance

Key support is around 0.705. A drop below this may lead to further declines.

Strong resistance at 0.710, coinciding with a previous peak and consolidation.

Breaching these levels could provide significant market direction clues.

Actionable Insights

Consider buying if the price closes above 0.710 on strong volume and a confirming bullish candlestick pattern.

Observe for a potential sell if the price breaks below 0.705 with accompanying volume spikes.

Hold if the price remains between 0.705 and 0.710, absent convincing breakout signals.

The AI Technical Analysis Center is an informational tool only and does not constitute investment or trading advice.
This site is registered on wpml.org as a development site. Switch to a production site key to remove this banner.