Generic selectors
Exact matches only
Search in title
Search in content
Post Type Selectors

Popular stocks

Crypto

CFD

Currencies

Support

Gold

OIL – Technical Analysis – 4h

February 23, 2026 17:00

Quick Summary

The asset is exhibiting a clear upward trend in recent sessions, as demonstrated by the price movement from $62 to over $67. This significant appreciation highlights strong market confidence and buying pressure.

The overall technical indicators suggest a positive outlook, although some caution is advised due to possible consolidation signs. The analysis reveals potential for continued bullish activity in the asset’s price.

Candlestick Analysis

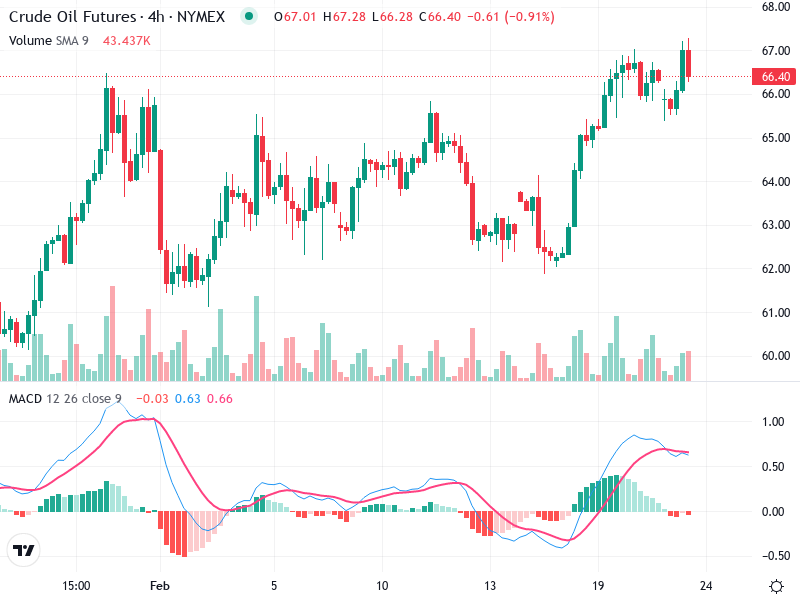
The general trend shows a bullish sentiment, with the price increasing from around $62 to above $67.

There are numerous bullish patterns, including a potential engulfing pattern, which indicates strong buying pressure.

A critical breakout occurred above $65, marking a bullish trend shift where any future pullbacks might find support.

MACD Analysis

The MACD line remains above the Signal line, reflecting ongoing bullish momentum.

The histogram suggests slowing bullish momentum, hinting at a potential consolidation or pullback phase.

No significant divergences between the MACD and price action are noted currently.

Volume Analysis

Volume has noticeably increased during the recent price surge, indicating support for the bullish move.

Increased volume during price rises generally suggests genuine buying interest and supports bullish momentum.

Volume spikes hint at possible institutional activity, especially evident during breakout phases.

Support & Resistance

Key support is identified around $65, in line with the recent breakout zones.

Resistance appears at approximately $67, with a breakthrough potentially leading to further gains.

Actionable Insights

Consider a buy strategy on a successful retest of the $65 support or a breakout above $67 with strong volume.

A sell strategy is recommended if the price drops below $65 with rising volume, indicating potential bearish correction.

A hold strategy is viable while monitoring any signs of decreasing momentum.

The AI Technical Analysis Center is an informational tool only and does not constitute investment or trading advice.
This site is registered on wpml.org as a development site. Switch to a production site key to remove this banner.